Installing ADT Eclipse frontend

This blog will explain the installation of the ABAP development tools (ADT) on the laptop or workstation.

Activation of the ABAP development tools needed on the backend is explained in this blog.

Questions that will be answered in this blog are:

  • Where can I find the software downloads?
  • Which Java version do I need?
  • What is the installation sequence?

Java version

As of February 2021 Java version 11 is mandatory. See OSS note 2949356 – Java 11 is mandatory for ADT in February 2021.

Software download of ADT tools

Software can be downloaded from the SAP public site: https://tools.hana.ondemand.com/ .

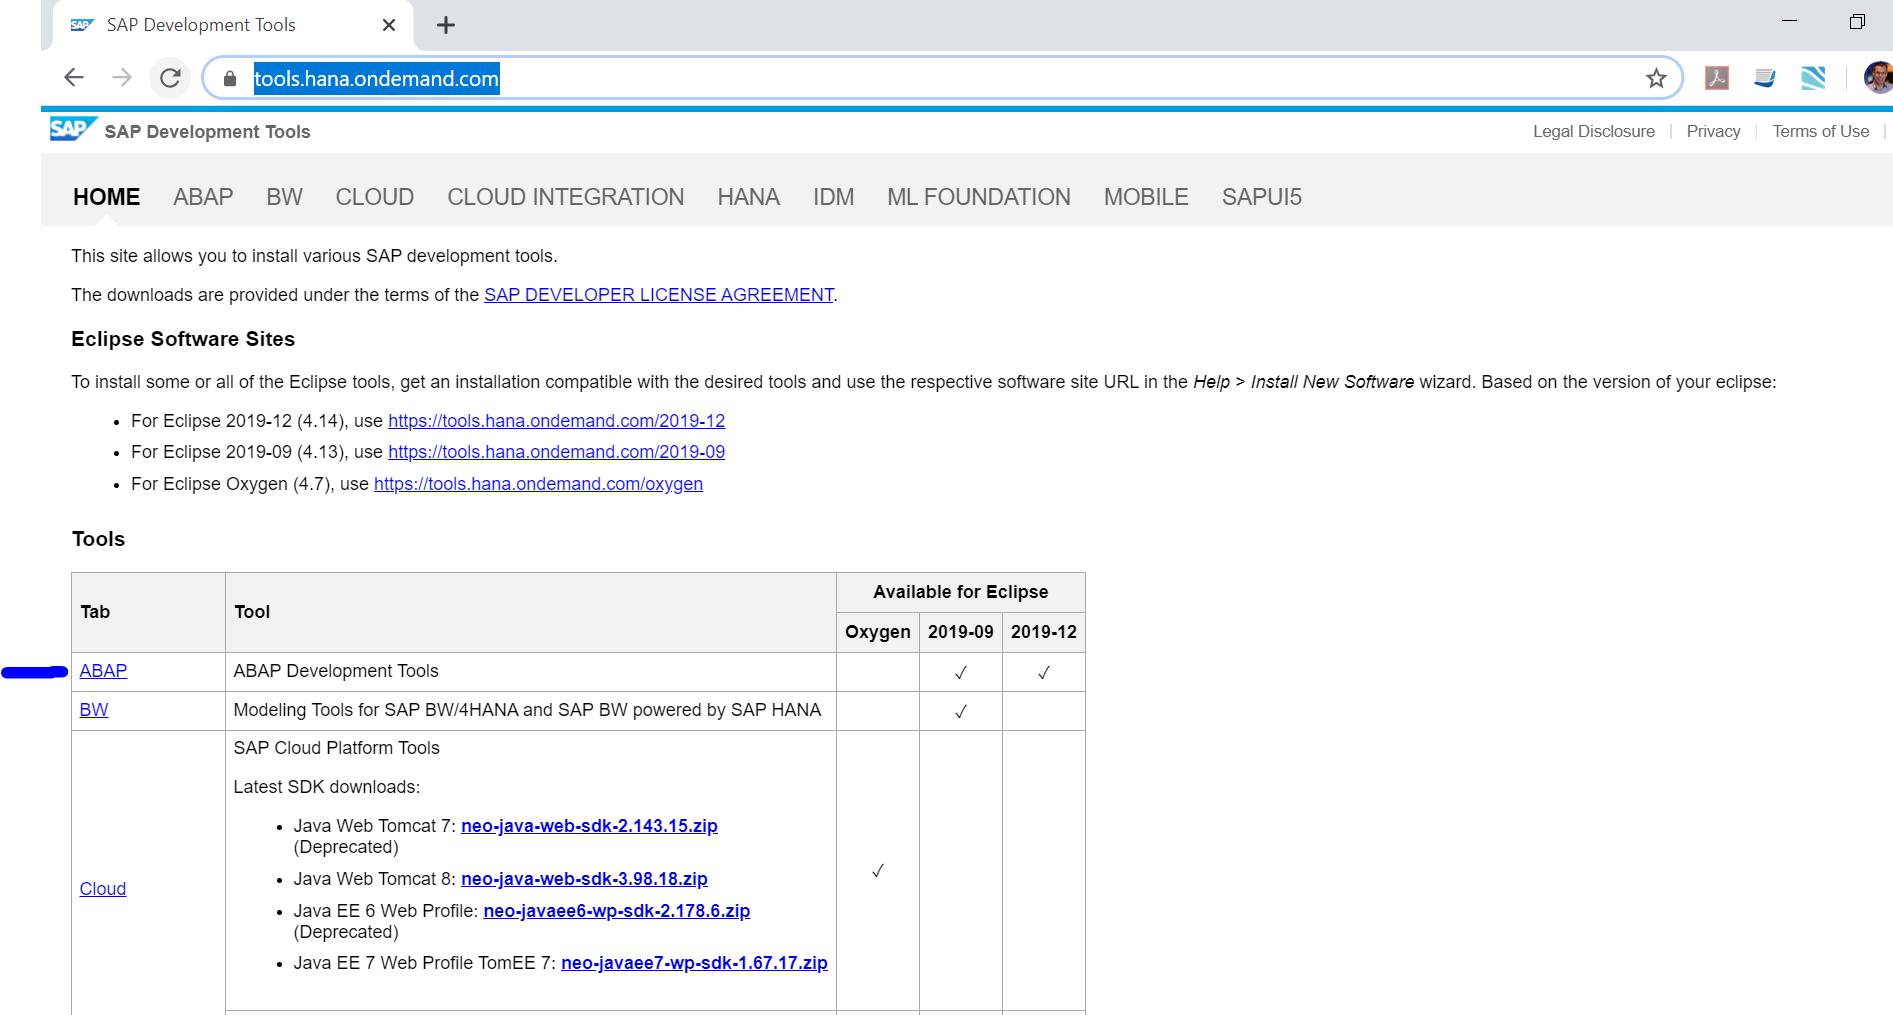
Click on the ABAP part:

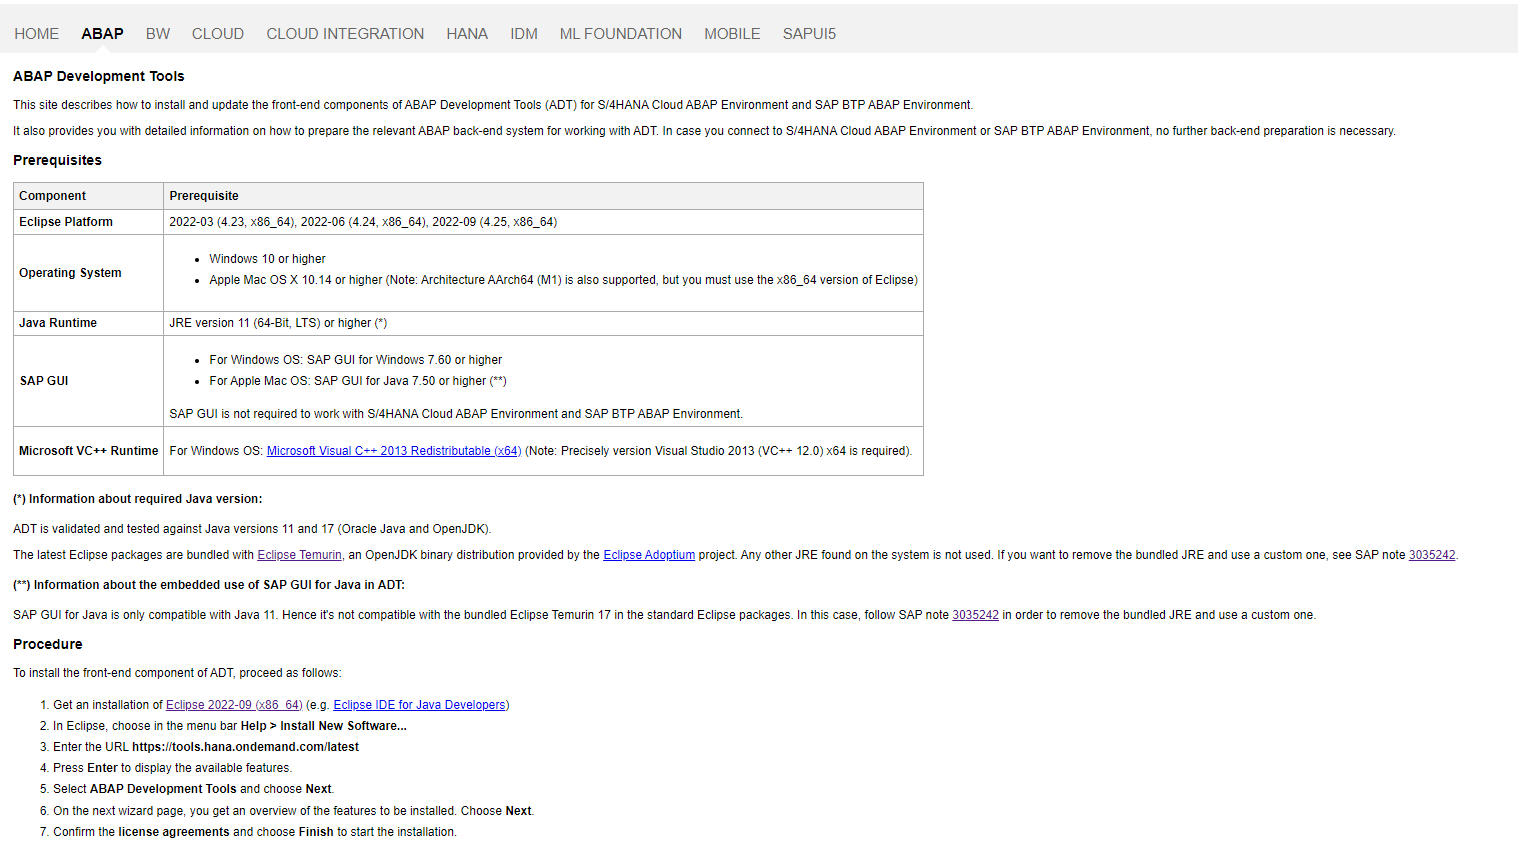
Download here the Eclipse version needed and check carefully the JAVA instructions. Pending on your local system a JAVA JRE might already be there or forbidden by your windows administrators. Check note 3035242 – Remove bundled JRE from Eclipse packages if needed.

Installation

Make a directory on your local machine called C:\ADT\.

Do not use spaces and special characters in the installation directory. This is a main cause of issues. 

Extract the files:

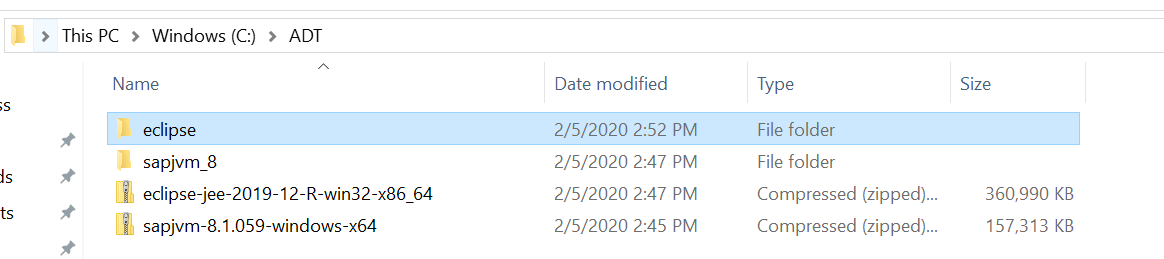
Now in the the directory Eclipse, you can launch Eclipse by double clicking on the executable:

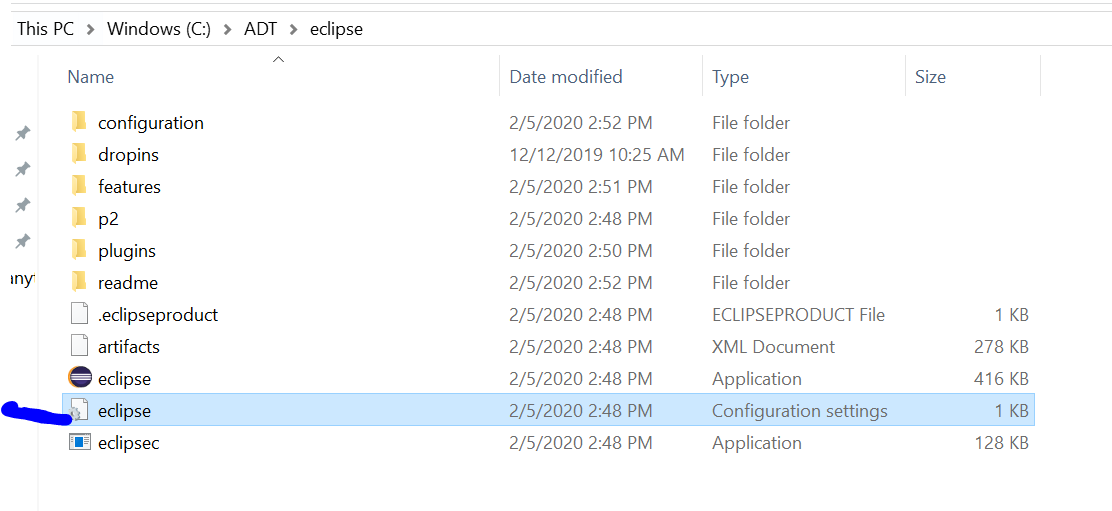
This will now launch Eclipse. If this works ok, skip the launch issue below and proceed to Installation inside Eclipse.

Launch issue

Depending on your JAVA installation and settings a Eclipse launch code might appear:

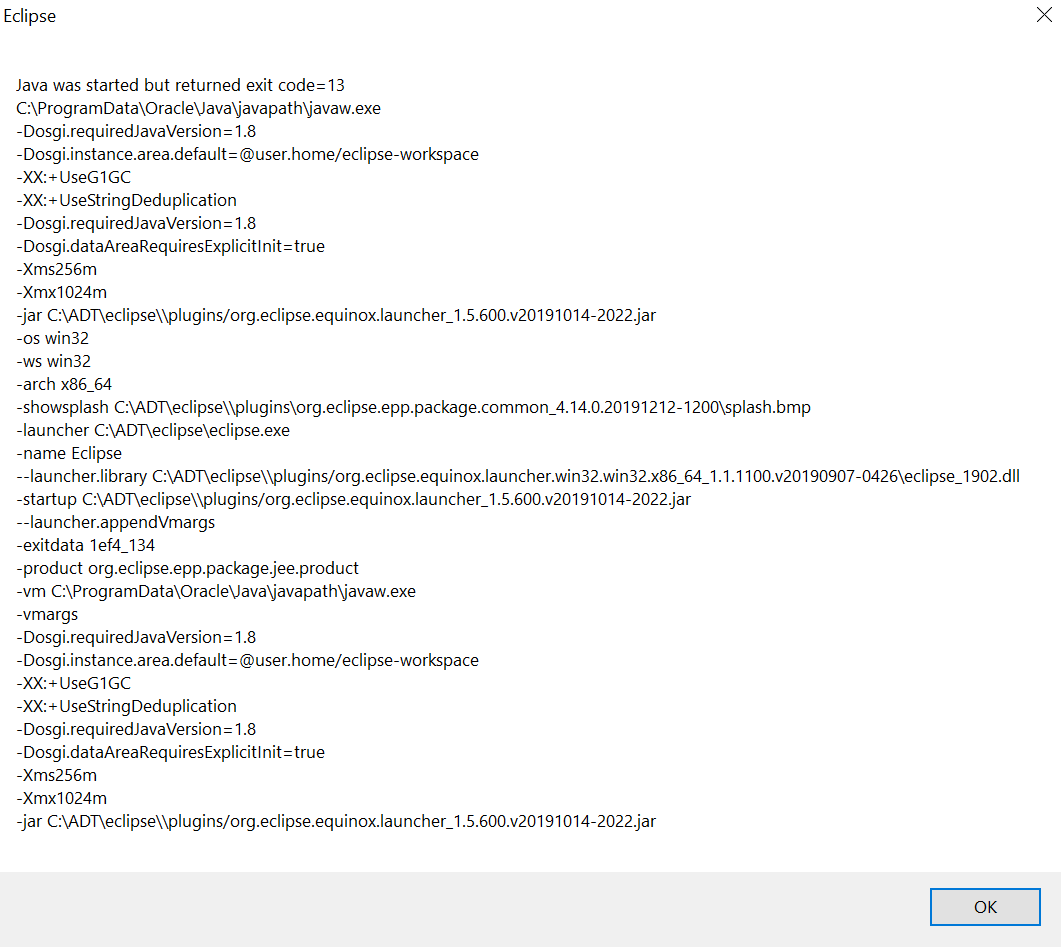
If this happens, most likely Eclipse can’t find a proper JAVA installation. In the previous step you have downloaded the SAP JVM files and extract them as well to the C:\ADT\ folder.

Now we need to edit the Eclipse.ini file:

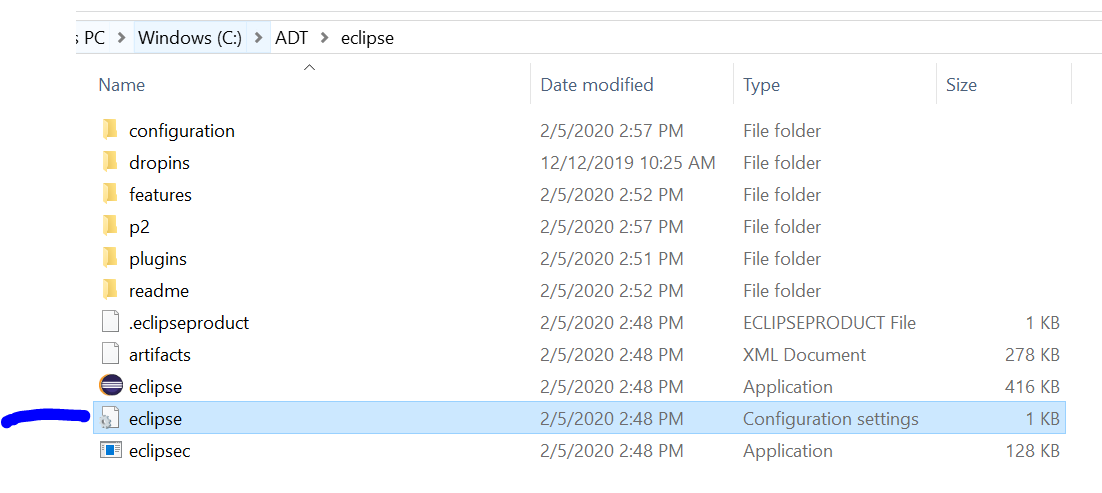
Edit the file and add the line to point to the SAP JVM:

-VM

C:/ADT/sapjvm_8/bin/javaw.exe

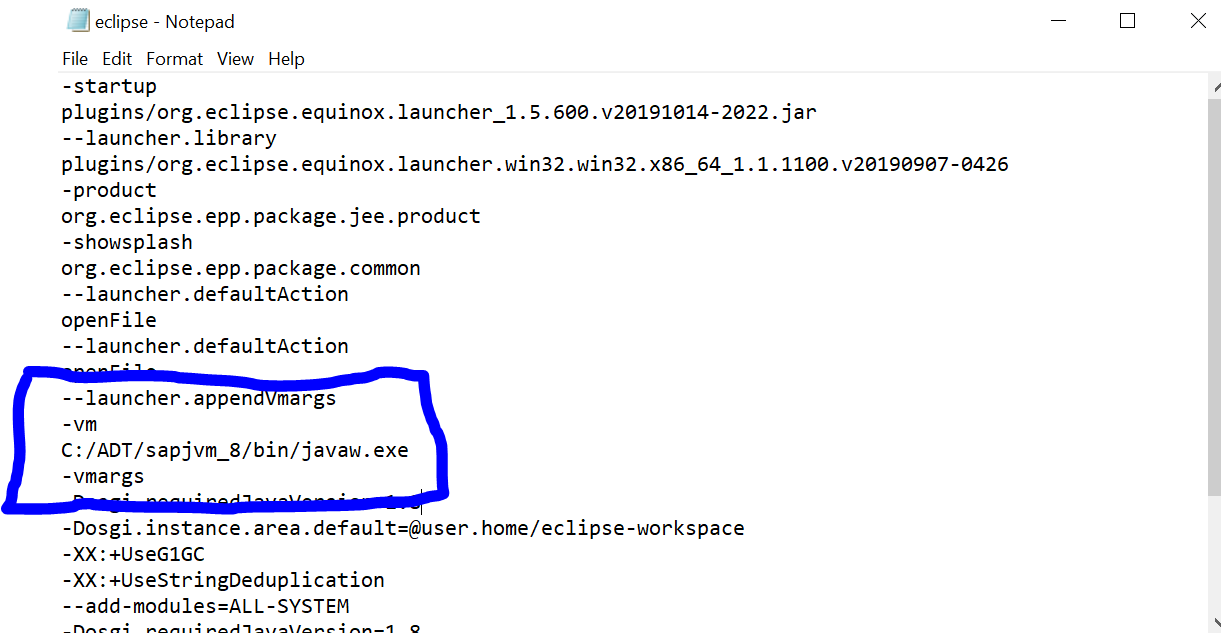
This has to be inserted at exactly the designated spot. Save the file and re-launch Eclipse.

Installation inside Eclipse

After first initial launch of Eclipse:

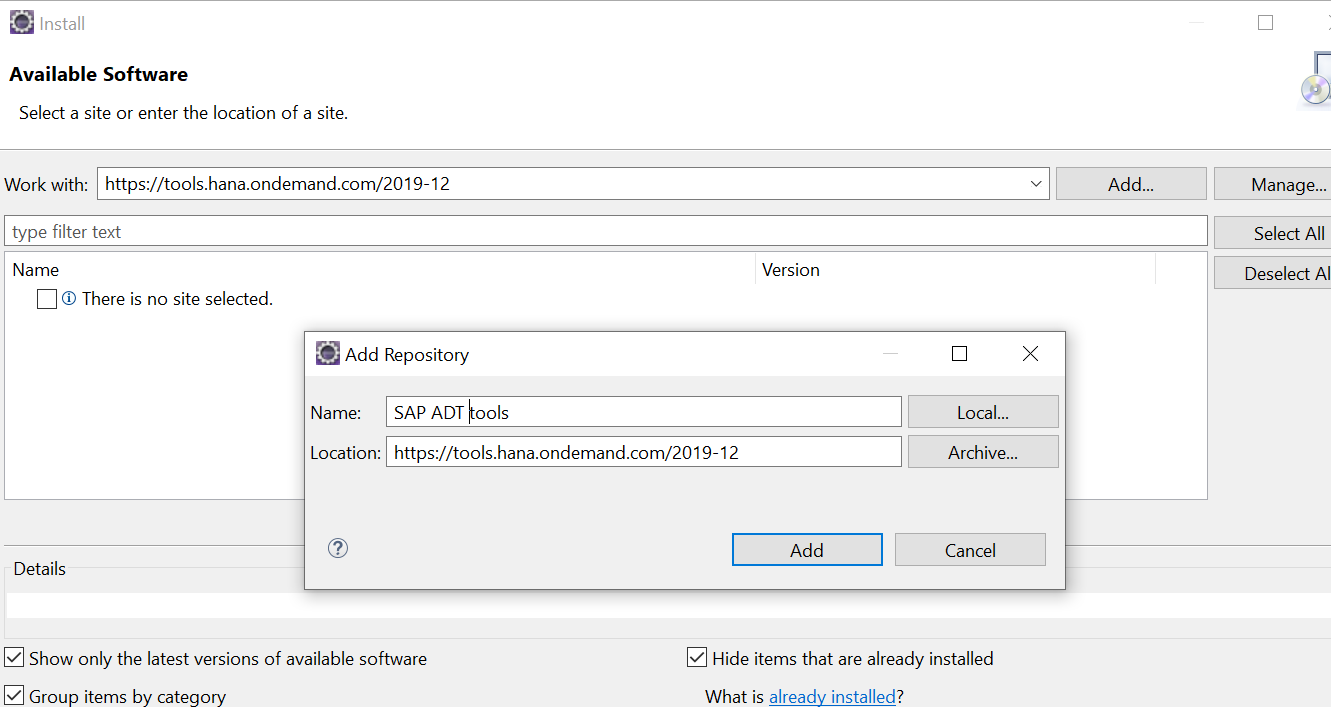
  1. In Eclipse, choose in the menu bar Help > Install New Software…
  2. Add the URL https://tools.hana.ondemand.com/latest

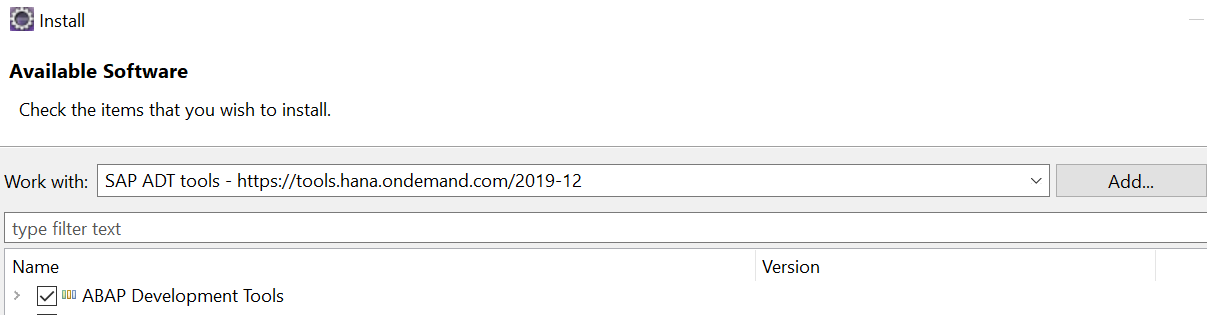
After this install is done Eclipse needs to restart.

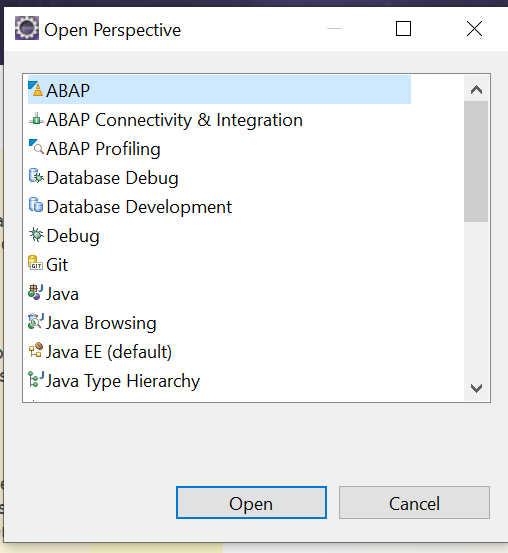
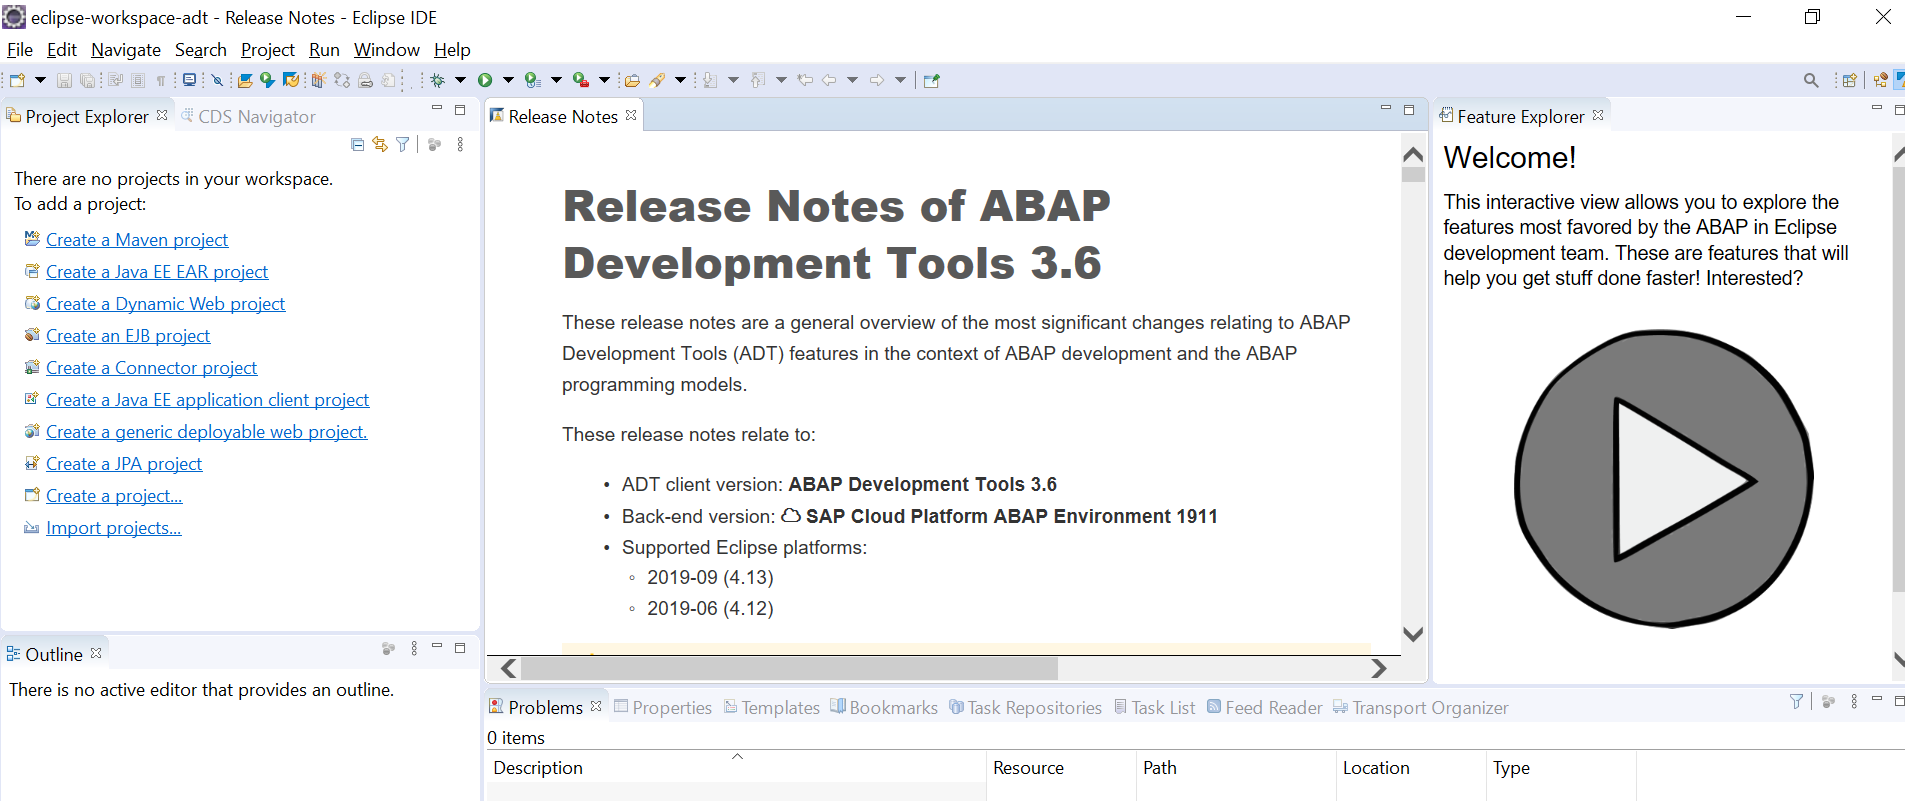
Now you can open the ABAP perspective in Eclipse:

ABAP Eclipse OSS notes

There might be bugs in Eclipse. In SAP OSS search for component BC-DWB-AIE to find bug fixes or explanations on specific functions.

Or look for the search term “quick fix” to find bug fix notes for the Eclipse quick fix function.

Clean ABAP Eclipse plug-in: ABAP cleaner

To speed up clean ABAP in practice, you can install the clean ABAP cleaner plug-in for Eclipse. Read this blog on how to do this.

qRFC tips & tricks

This blog will give tips and trick on the basis part of qRFC (queued RFC).

Questions that will be answered are:

  • How to assign a specific server group to qRFC?
  • How to correct host ID in SMQS?
  • What to do with the scheduler error RES_LACK?
  • What to do when inbound entries in SMQ2 stay in status RETRY?
  • How to check performance of qRFC?
  • How to check consistency of qRFC?
  • How can I activate the application log to detect manual actions performed on qRFC?
  • How to monitor qRFC?
  • In which table is qRFC header data stored?

Assigning specific server group for qRFC

In RZ12 you have defined a specific server group. In SMQR or SMQS you can assign that server group with menu option Edit / Change AS group:

Check also note: 3159931 – SM58 tRFC failed with “Error when opening an RFC connection (CPIC-CALL:”.

How to correct host ID in SMQS?

After a system copy the host ID in SMQS might be still pointing to the old system. To solve this, goto SM51 and select menu option Goto / Host Name Buffer / Reset / Entire System. Then go back to SMQS and re-activate the scheduler via menu option Edit / Activate Scheduler. See also OSS note 2377064 – How to correct the host ID in SMQS.

Empty host ID in SMQS

Initially the host ID in SMQS is empty. After the first message is sent, the host ID will be filled. See OSS note 2915187 – SMQS Host ID is blank or empty.

Outbound scheduler in status RES_LACK

If the outbound scheduler SQMS has the status RES_LACK, then the amount of DIA versus BTC processes is not balanced. Follow the instructions from OSS note 1970757 – Outbound qRFC scheduler with status RES_LACK to balance the processes.

Deletion of queued messages

Deletion of queued messages is possible, but should be done with care. After deletion, support can be lost on certain functions. See for example OSS note 2375304 – Deleted queues from SMQ2. You can apply OSS note 2837536 – Customer Connection – Improvement Request 217719 – Authorization check for message deletion in Smq2 / Smq3 to restrict the access to message deletion via special authorization object.

Inbound queues SMQ2 stay in status RETRY

When inbound entries in SMQ2 queue remain in status RETRY, this is normally caused by lack of authorization for launching batch job. This can happen to background user and user reprocessing the jobs. Check the authorization trace to see what needs to be fixed. More background in OSS note 1862256 – Inbound queues (SMQ2) stay in status RETRY.

Queue in the inbound queue scheduler SMQ2 with “Name or password is incorrect (repeat logon)”

When you get this issue a password change of the RFC might be required. Read more in OSS note 2474161 – Queue in the inbound queue scheduler SMQ2 with “Name or password is incorrect (repeat logon)”.

Queue resets via batch jobs

Report RSQOWKEX can be used to reset the outbound queue. RSQIWKEX can be used to reset the inbound queue. The goal is to reprocess messages in error state like SYSFAIL, CPIERR. More details are in OSS note 2552322 – RSQOWKEX and RSQIWKEX. Note 2195856 – Double message execution explains to be careful with using these programs with status RETRY.

These programs can be scheduled in batch mode to automate reprocessing.

Consistency checks of qRFC

Consistency checks of qRFC:

  • You can identify and delete inconsistencies in the outbound queue using report RSTRFCEG.
  • You can identify and delete inconsistencies in the inbound queue using report RSTRFCEH.

Background is described in OSS note 779664 – Consistency check of qRFC queues with deletion.

Deletion of unprocessed LUW’s in qRFC

Deletion of unprocessed LUW’s in qRFC: background is described in OSS note 760113 – Delete unprocessed LUWs in the qRFC.

Application log for qRFC manual processing

In SMQ1 and SMQ2 manual actions can be done, which are normally not logged. Apply OSS note 3031450 – Application log for inbound qRFC monitor such as SMQ2 to get the actions logged in the application log.

Alerting of failed qRFC in EWM systems

qRFC is very important in EWM systems. In EWM systems there is a built in program for alerting on qRFC failures: /SCWM/R_QRFC_QUEUE_ALERT. More on this feature you can read in OSS note 2226372 – EWM – Alerting for Failed Queues.

Issues with destination NONE

When using qRFC with SQMS for destination NONE, you can have unwanted interference with tRFC. See OSS note 1813159 – Hanging LUW´s in SM58 with the function module IDOCS_OUTPUT_TO_R3. Set the registration of NONE with flag ‘w/o tRFC’ on. And make sure the max connections is not set to 1, but much higher.

Issues with performance of qRFC

OSS note 2183108 – t/qRFC processing: general performance verifications contains program Z_RFC_QUEUE_PERF. This program can be run to check for potential performance issues. Output example:

Deleting saved queues in SMQ3

To delete saved queues in SMQ3, follow the instructions in OSS note 2558561 – Delete saved queues in SMQ3.

Monitoring of qRFC

SAP Focused Run can be used to monitor qRFC’s. Read more in this blog.

Storage of qRFC header data

Header data of qRFC is stored in tables TRFCQIN and TRFCQOUT.

Reference OSS notes

Reference OSS notes:

Bug fix OSS notes

Bug fix OSS notes:

SWLT performance tuning worklist

This blog explains how to use the SWLT performance tuning worklist to find poorly performing Z code by combining SQL monitoring data from production and ATC results.

Questions that will be answered are:

  • How to setup the SWLT performance tuning worklist tool?
  • How to analyze the results from the SWLT performance tuning worklist tool?

Preparations

As preparation for the SWLT tool you must have run the SQL monitor in a productive system and created a snapshot of the data. This snapshot you can export and import in a development system (see note 2700312 – How to import SQL Monitor (SQLM) extracted data). In the development system you configure and run the ATC code check tool.

The SWLT performance tuning worklist tool will combine these results. As example we will use this poorly written Z code:

Running the SWLT tool

Start transaction SWLT:

You can reduce the scope by just taking the needed Z packages. Goto the tab Static Checks to select the appropriate result of the ATC run (for more on ATC read this blog):

Now select the SQL monitor tab to select your SQLM data snapshot you took from your productive system:

Now that all data is loaded, you can hit the execute button to start the SQL performance tuning worklist.

It might be you don't see the SQLM snapshot in SWLT. In that case create a new snapshot from SWLT directly.

The tool will now start to merge the results. In the example above you can see the following result:

In the total result select a line. On the bottom left you can see the SQL monitor results. Bottom right you can see the ATC check result. Clicking on the underlined program or SQL statement will bring you to the poorly performing ABAP code point.

Bug fix notes

3060630 – Runtime error RUNT_INTERNAL_ERROR while fetching SQLM data (e.g. via SWLT)

SQLM SQL monitor

This blog will explain about the SQLM tool to monitor expensive SQL statements in a productive environment.

Questions that will be answered are:

  • How to start and configure the SQLM tool?
  • How to analyze the results?

Configuration of SQLM tool

The SQLM tool does not require specific configuration or installation if you have a bit modern SAP system. To activate it start transaction SQLM and click on the Activate button for All Servers:

The trace is active now until the given time frame.

Example use of the SQLM transaction

First we start by writing a very bad performing Z program:

This program is really inefficient. After activation of the SQLM monitoring we run this program a few times.

Now we goto the SQLMD transaction (or from SQLM and then press display data button) to display the SQL monitoring results:

Selection can be done on total number of executions, execution time, amount of records. Result:

You see now the impact of our badly written program. Double click on the line will jump to the ABAP code point.

Creating snapshots

At the bottom of the SQLM start screen there are the buttons to create snapshots:

This results into the Snapshot screen:

You can create a snapshot here for later re-use. You can also download the snapshot to a different system by using these buttons: first export to file:

When you have the file, goto the target system and start SQLM and press create snapshot. Now use the option Create with Data Source File Import.

It is common practice to capture data in production by a basis administrator who exports it. Then the data download is handed over to an ABAP developer using the data as upload in SQLM database in the development system to improve poorly performing Z code. The developer can use the SWLT tool (see blog) to combine the SQLM data with the static code review data taken from the ATC tool (see blog).

Follow up use in SWLT

The SQLM data can be used as input in the SWLT tool: SQL performance worklist tool. This tool combines the SQLM data with the ATC tool results. Read more about SWLT in this blog.

Background information

More background information can be found in OSS note 1885926 – ABAP SQL monitor and 3242700 – ABAP SQL Monitor: Implementation Guide and Best Practices.

Useful blog (which is start of blog series on SQLM): link.

Impact on performance and memory is minimal. Description is fully documented in OSS note 3100598 – Memory Requirement and Performance Impact of the SQL Monitor.

OSS notes

Relevant OSS notes: