This blog will explain about getting insight into SAP database growth and controlling the growth.
Questions that will be answered are:
- Do I have a database growth issue?
- What are my largest tables?
- How do I categorize my tables?
Why control database growth?
Controlling database growth has several reasons:
- When converting to S/4 HANA you could end up with smaller physical HANA blade and need to buy less memory licenses from SAP
- Less data storage leads to less costs (think also about production data copied back to acceptance, development and sandbox systems)
- Back up / restore procedures are longer with large databases
- Performance is better with smaller databases
Database growth
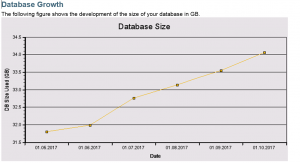
The most easy way to check if the database is growing too fast or not is using the Database Growth section in the SAP EWA (early watch alert). The EWA has both graphical and table representation for the growth:


Or you can check online in the EWA workspace.
You now have to determine if the growth is acceptable or not. This depends a bit on the usage of the system, amount of users, business data, and if you already stretched your infrastructure or not.
General rules of thumb:

1. Growth < 1 GB/month: do not spend time.
2. Growth > 1 GB/month and < 5 GB/month: implement technical clean up.
3. Growth > 5 GB/month: implement technical clean up and check for functional archiving opportunities.
Which are my largest tables?
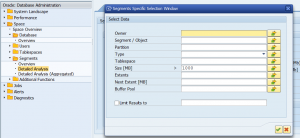
To find the largest tables and indexes in your system start transaction DB02. In here select the option Space/Segments/Detailed Analysis and select all tables larger than 1 GB (or 1000 MB):

Then wait for the results and sort the results by size:

You can also download the full list.
Analysis of the large tables
Processing of the tables is usually done by starting with the largest tables first.
You can divide the tables in following categories:
- Technical data: deletion and clean up can be done (logging you don’t want any more like some idoc types, application logging older than 2 years, etc): see blog on technical clean up
- Technical data: archiving or storing can be done (idocs you must store, but don’t need fast access to, attachments)
- In Oracle based systems, you might find large SYS_LOB tables. To analyze these, read this special blog.
- Functional data: archiving might be done here: for functional data archiving see this blog on technical execution, and this blog for business discussions.
SAP data management guide
SAP has a best practice document called “Data Management Guide for
SAP Business Suite” or “DVM guide”. This document is updated every quarter to half year. The publication location is bit hidden by SAP under their DVM (data volume management) service. In the bottom here go to SAP support and open the How-to-guides section. Or search on google with the term “Data Management Guide for SAP Business Suite” (you might end up with a bit older version). The guide is giving you options per large table to delete and/or archive data.
Common technical objects
Most common technical tables you will come across:
- EDIDC, EDIDS, EDI40: idocs
- DBTABLOG: table changes
- BALHDR, BALDAT: application logging
- SWW* (all that start with SWW): workflow tables
- SYS_LOB…..$$: attachments (office attachments and/or DB storage of attachments and/or GOS, global object services attachments)
Detailed table analysis for functional tables: TAANA tool
For detailed analysis on functional tables the TAANA (table analysis) tool can be used. Simply start transaction TAANA.
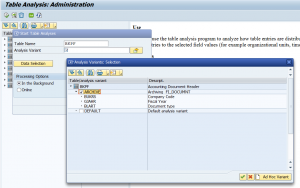
Now create a table analysis variant by giving the table name and selection of the analysis variant:

The default variant will only do a record count. Some tables (like BKPF in this example) come with a predefined ARCHIVE variant. This is most useful option. If this option does not fit your need, you can also push the create Ad Hoc Report button and define your own variant.
Caution: with the ad hoc variant select your fields with care, since the analysis will count all combinations of fields you select. Never select table key fields
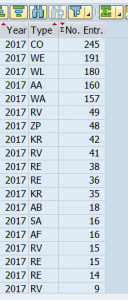
Results of TAANA are visible after the TAANA batch job is finished.

By running the proper TAANA analysis for a large functional table you get insight into the distribution per year, company code, plant, document type etc. This will help you also estimate the benefits of archiving a specific object.
For TAANA improvement on dynamic subfields, please check this blog.
If you run on HANA, you can also use SE16H for the table analysis.
Bug fix OSS note for TAANA:
Alternatives for TAANA
If you are running on HANA, you can also check using SE16H and SE16S.
From analysis to action
For the technical clean up read the special blog on this topic. For functional objects, you need to find the relation from the table to the functional data archiving object. This relation and how to find it is clearly explained in OSS note 2607963 – How to find the relationship between table and archive object.
SAP data volume management via SAP solution manager
SAP is offering option to report on data volume management via SAP solution manager directly or as a subsection in the EWA. Experience so far with this: too long in setup, too buggy. The methods described above are much, much faster and you get insight into a matter of hours. The DVM setup will take you hours to do and days/weeks to wait for results…. TAANA and SE16H are way faster.
4 thoughts on “SAP database growth control: getting insight”