If you are running a global system you want to see the usage of the system round the clock. Unfortunately the standard delivery of SAP is summing up the early morning and night hours in the ST03N time profiling.
This blog will explain you how to change this to 24 hours statistics recording.
Questions that will be answered in this blog are:
How to switch to 24 hour time profiling?
How does the result look like?
General information on ST03N can be found in this blog.
Switching to 24 hour time profiling
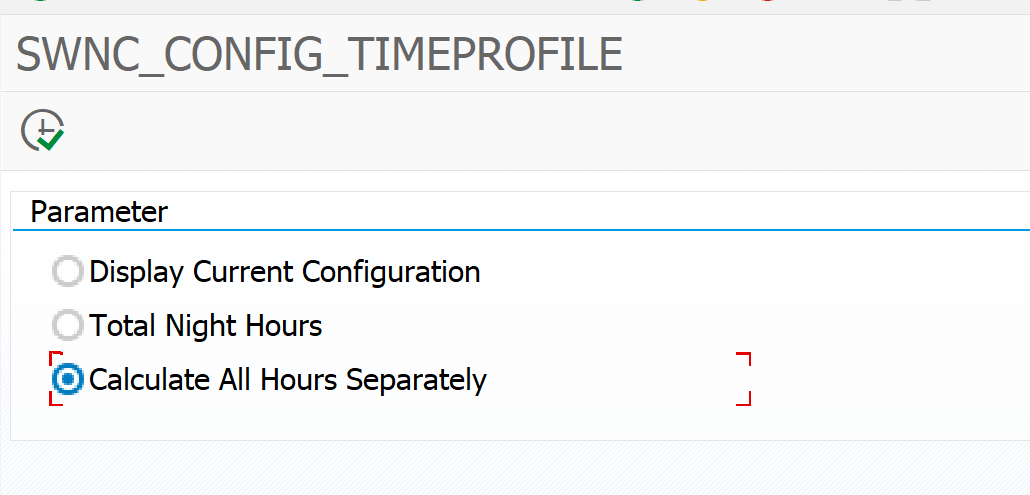
To switch to 24 hour time profiling start program SWNC_CONFIG_TIMEPROFILE:
Select the Calculate All Hours Separately option and hit the execute button. Done.
The end result
Before you can see the end result you best wait one week for the changed statistics to record.
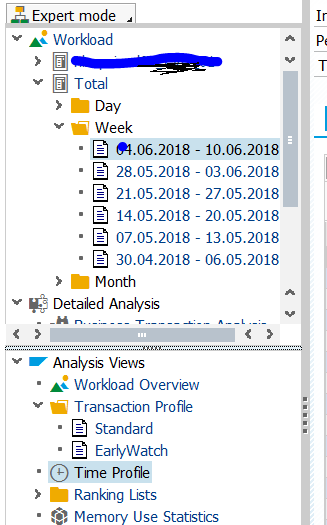
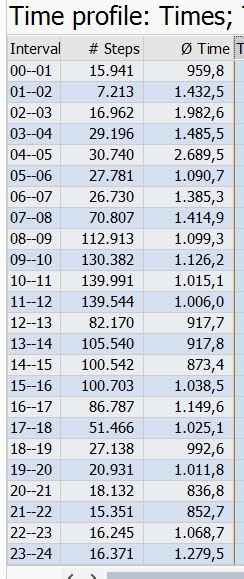
After 1 week go to transaction ST03N and select the Time Profile option in the expert section:
SAP has delivered a new transport check tool. Goal of the check tool is to make sure your imports are done successful. The tool is designed to answer the following questions:
Do I import transports in the right sequence?
Do I have dependency on other transports, which are not yet imported?
Are there objects in the transport also used in other transports, which I should also import now, or when I do later make a downgrade?
How long will the import time take?
SAP transport check tool
The transport check tool is a program with name /SDF/CMO_TR_CHECK, or transaction code /SDF/TRCHECK. It is delivered in updates of ST-PI component. You can run this program in the normal system or from SAP solution manager.
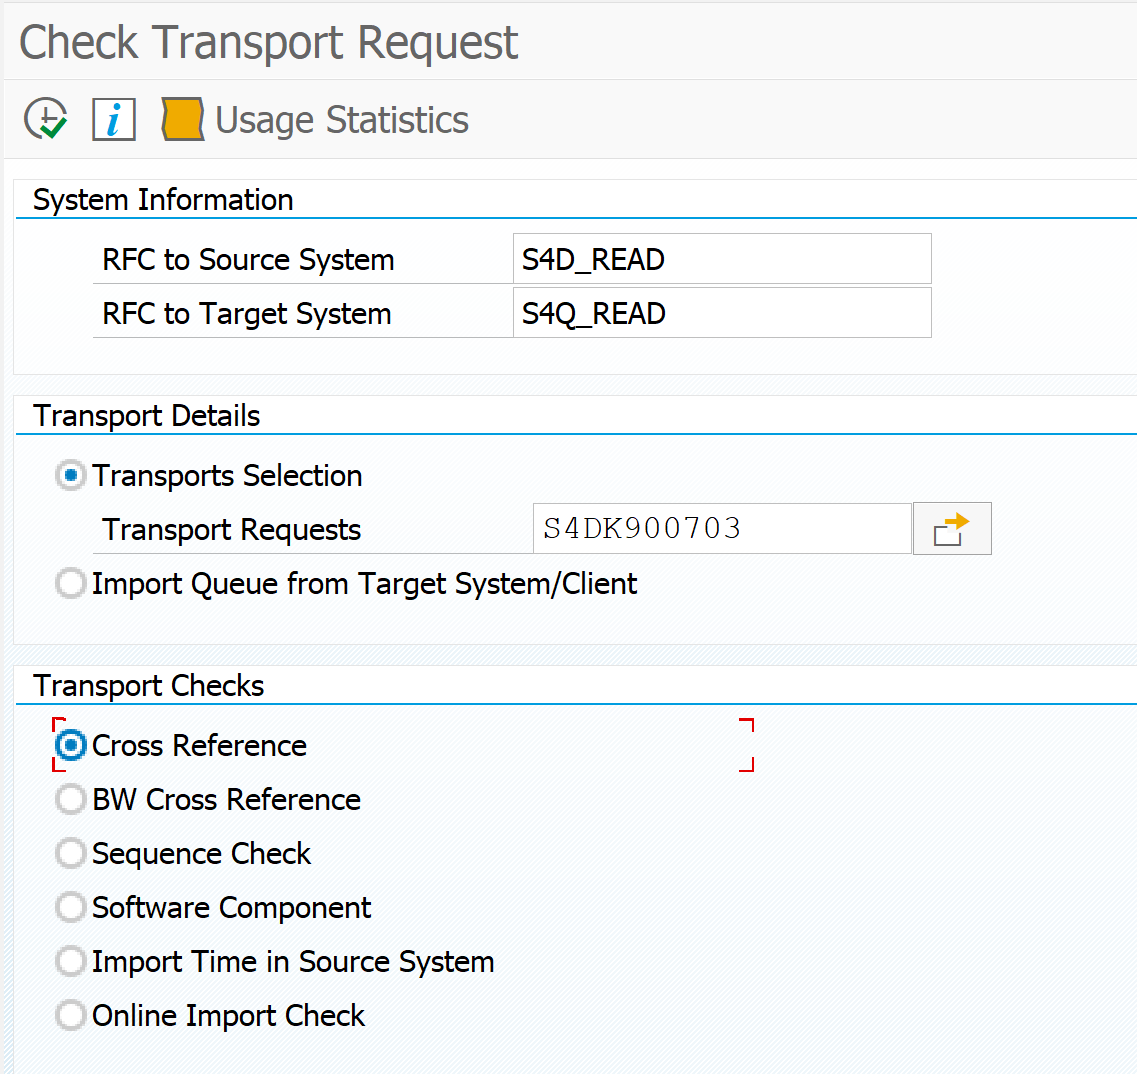
If you start you get the following initial screen:
Here you see that you need 2 RFC’s: one to the source system where the current transports are and one to the target system where the imports will happen.
Tip: make 2 variants for this program. One is called quality import with RFC source is development and target is quality system. Second is called production import with source is quality and target is the productive system.
In the transport details you can enter 1 or more transport numbers you want to validate. Enter in the transport list the sequence of wanted import.
Important for multiple transports: sequence does matter! If you enter transports in sequence A1, A3, A2 this will give different result from A1, A2, A3.
Cross reference check
The cross reference check will take all the objects in the transport and will execute a where used list in the target system and will check their versions. If any strange thing is found in missing items, or potential version conflicts, you will be alerted. If check is ok the list of items will be empty.
The sequence check will check the sequence of your transports if they are in the right order. It will also check other transports as well for containing the same objects, which have not yet been imported to the target system. If any strange thing is found in missing items or potential version conflicts you will be alerted. If check is ok the list of items will be empty.
Import time in source system
This check will add up the import times of the transport in the source system. This will be a good indication for import time needed in the target system. Example: if import to quality system took 2 minutes, you can expect productive import to be about 2 minutes as well. If the import to quality took 2 hours, you might want to decide more carefully on the exact time of import to productive system.
Online import check
The online import check is for checking critical objects inside the transports. This needs to be configure in the target system of the transport. Read more in this dedicated blog.
History of transport check tool runs
If you use the option Save Results, the results of the analysis will be saved for future reference. These can be retrieved via the History button on the first screen of the transport analysis tool or via program /SDF/CMO_TR_CHECK_HISTORY.
More information
More information on the check can be found by hitting the I (information) button on the program itself. Features of the tool including the PDF explaining the setup of the Online Import Check feature can be found in OSS note 2475591 – Transport Check Report.
Generic SAP blog on the transport tool and its usage can be found here and here.
Specific SAP blog on cross reference check can be found here.
This tool is also subject to having bug fixes. The bug fixes can be needed centrally on the SAP solution manager system and on the SAP systems that are being checked for transport imports.
This blog will explain how to setup print list archiving.
Questions that will be answered are:
What is use case of print list archiving?
How to setup print list archiving?
How to test print list archiving?
How to troubleshoot issues with print list archiving?
Goal of print list archiving
The business sometimes needs to store report output for a longer period of time. They can print the information and put it in their archive. This leads to a big physical archive.
You can also give the business the option store their output electronically in the SAP content server.
Set up or check content repository
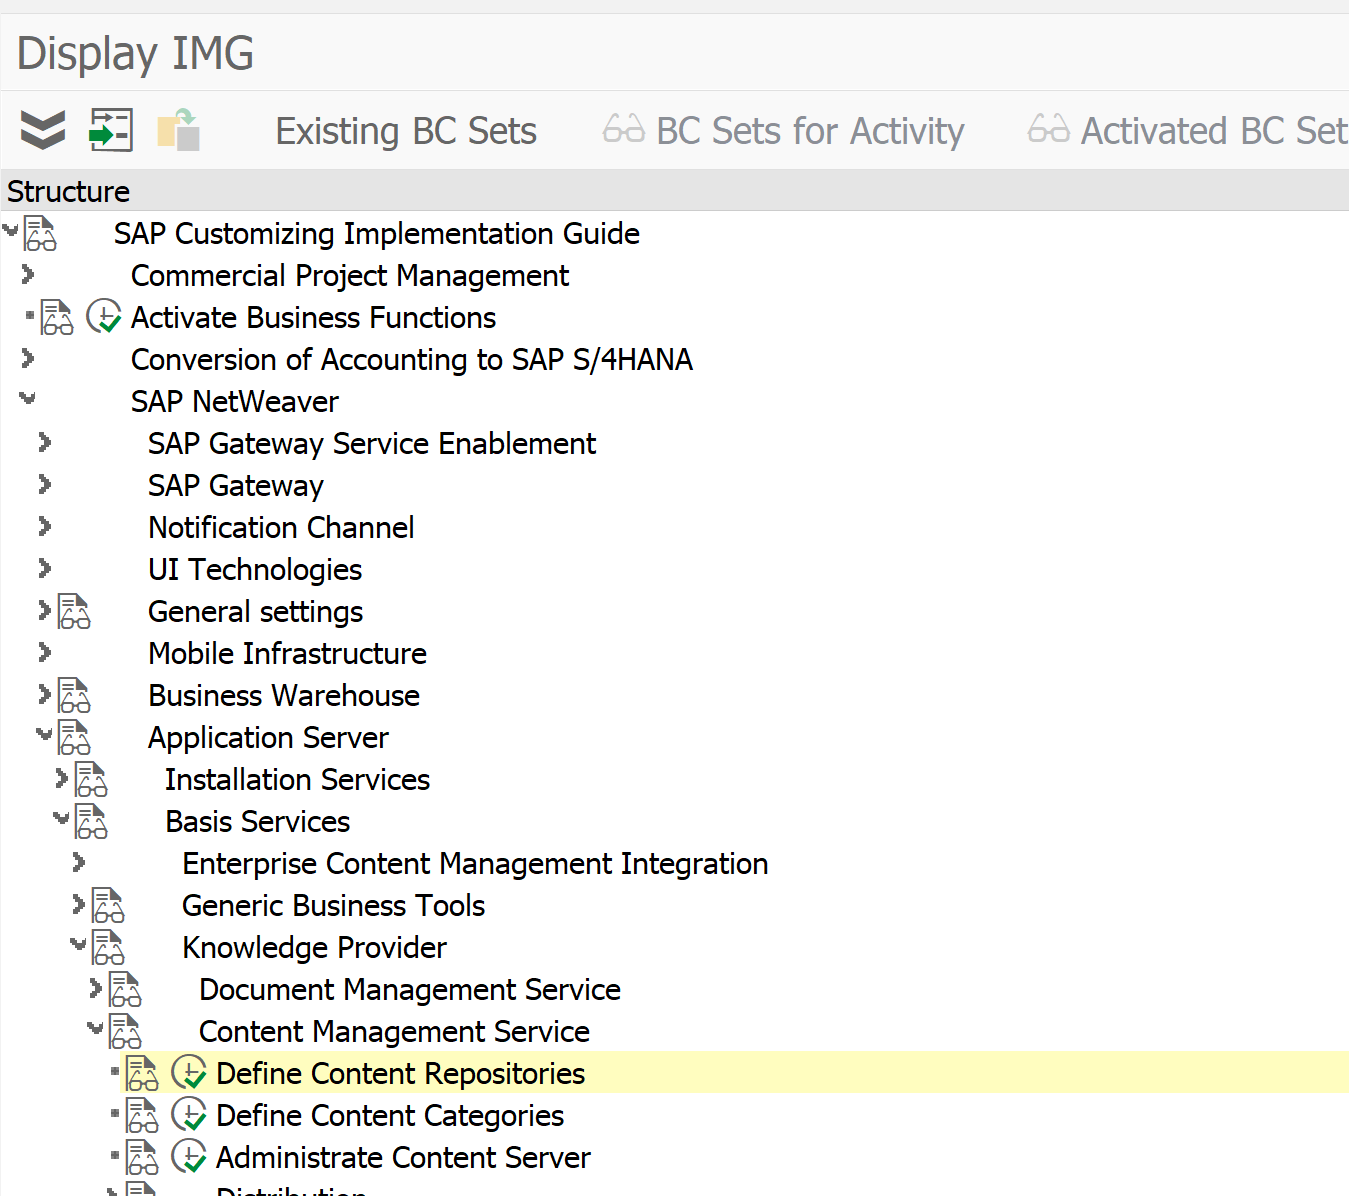
First check which content repository you want to use to store the print lists. The type of content repository must be “ARCHLINK”. Menu path in customizing is as follows:
Or you can go there directly with transaction OAC0.
Content repository A2 is default present in the system and is used in the example below. A2 is pointing towards the SAP database for storage. For productive use a SAP content server in stead of SAP database.
Customizing for print list archiving
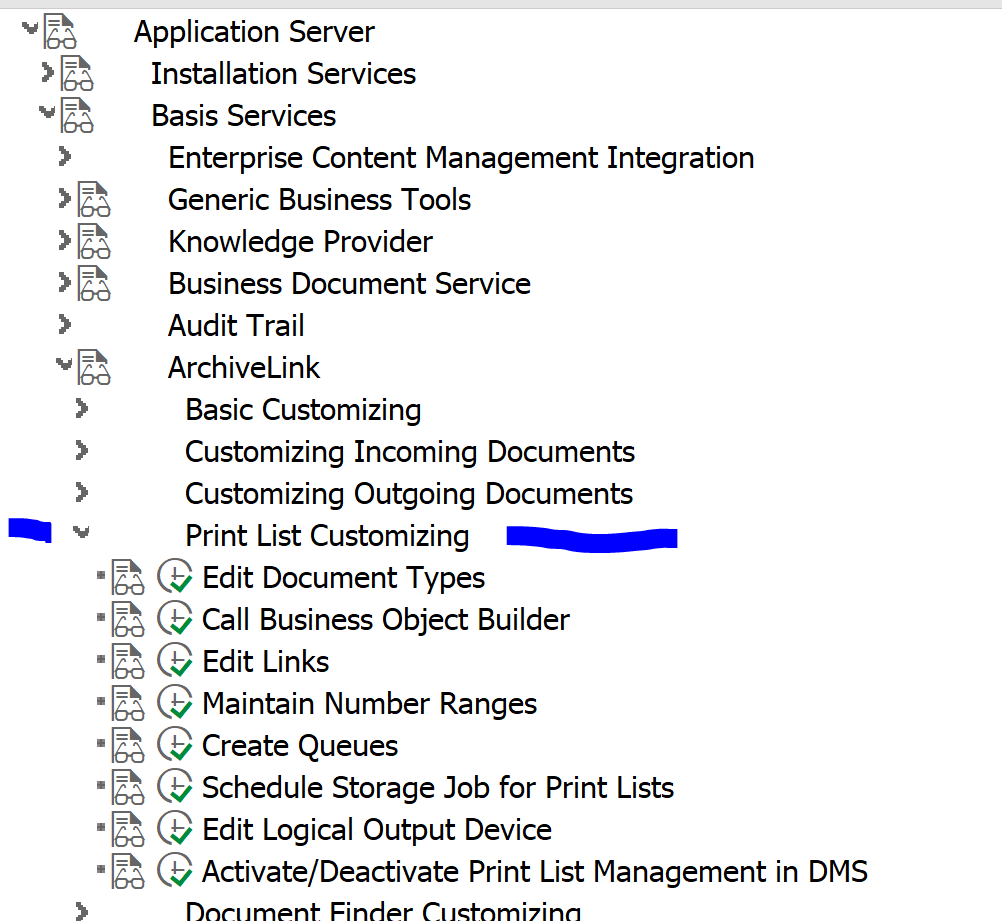
In the following customizing path you find all the actions required for the print list archiving:
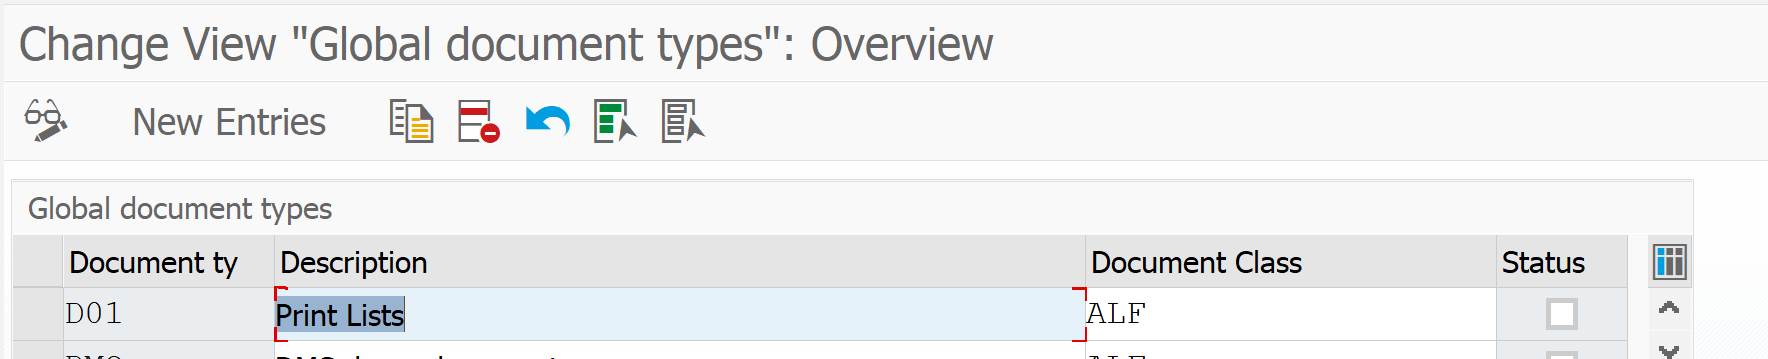
First check that print list document type D01 is present and is using ALF as document class:
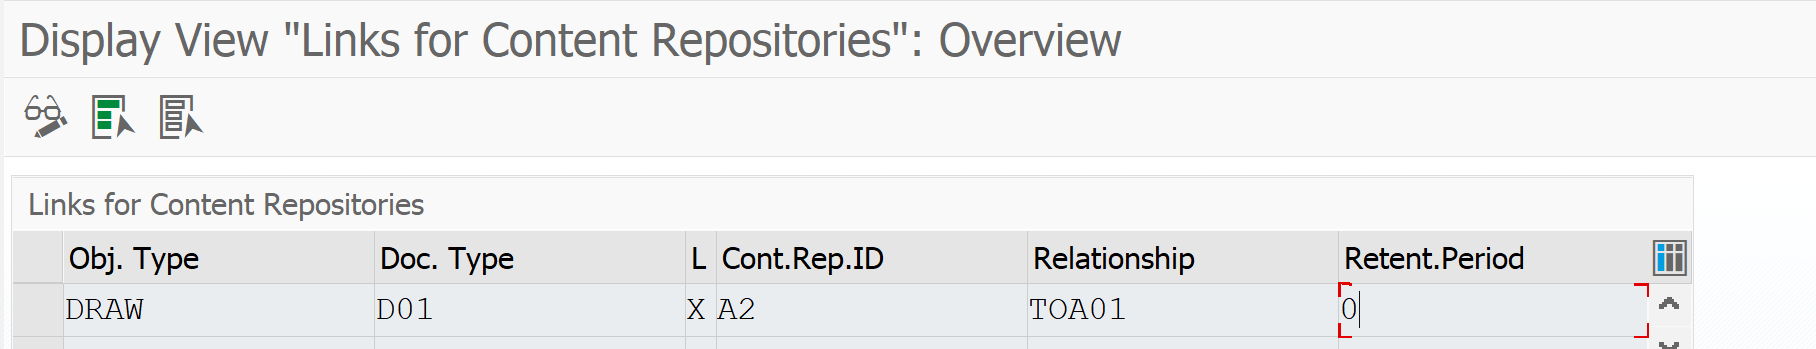
In the Edit links section, you can set for document type D01 which content repository is should use.
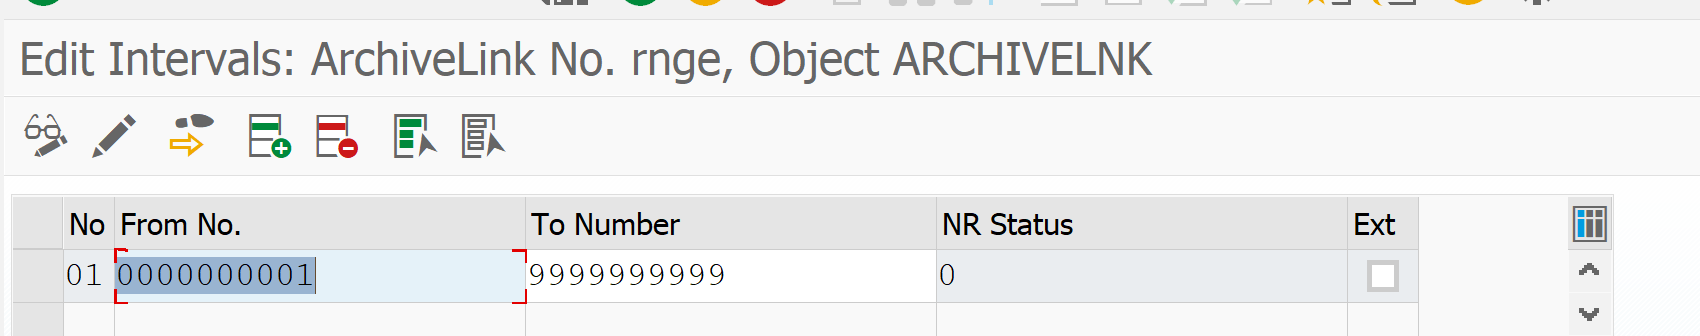
Then check if the number ranges for archivelink are properly maintained (if empty create new number range):
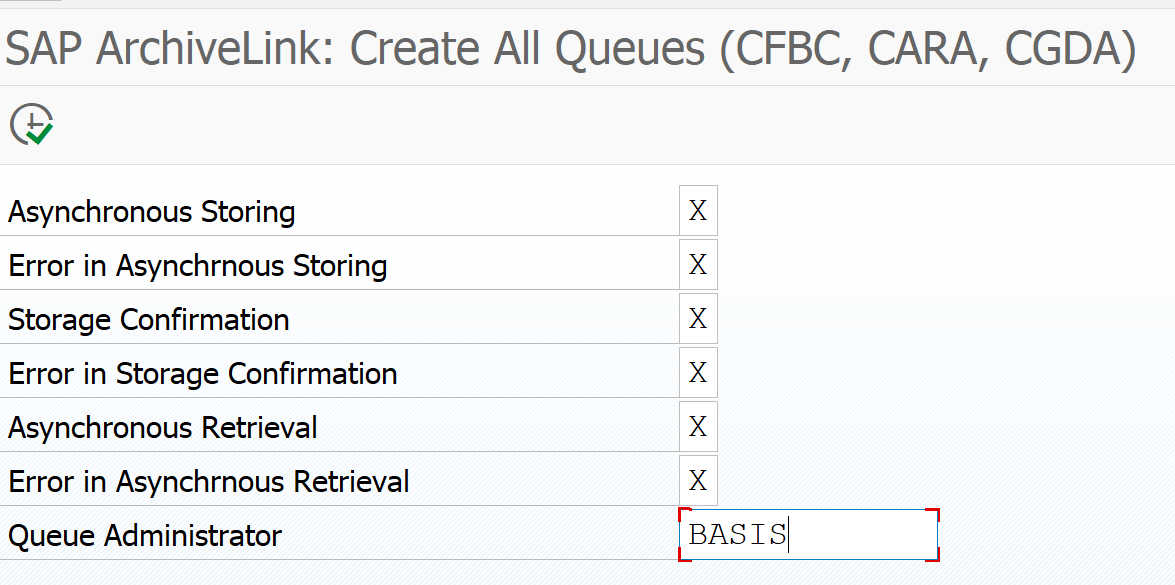
Then activate the print list queues:
Next step is to select the action to schedule the storage job. This job should not run faster than every 15 minutes.
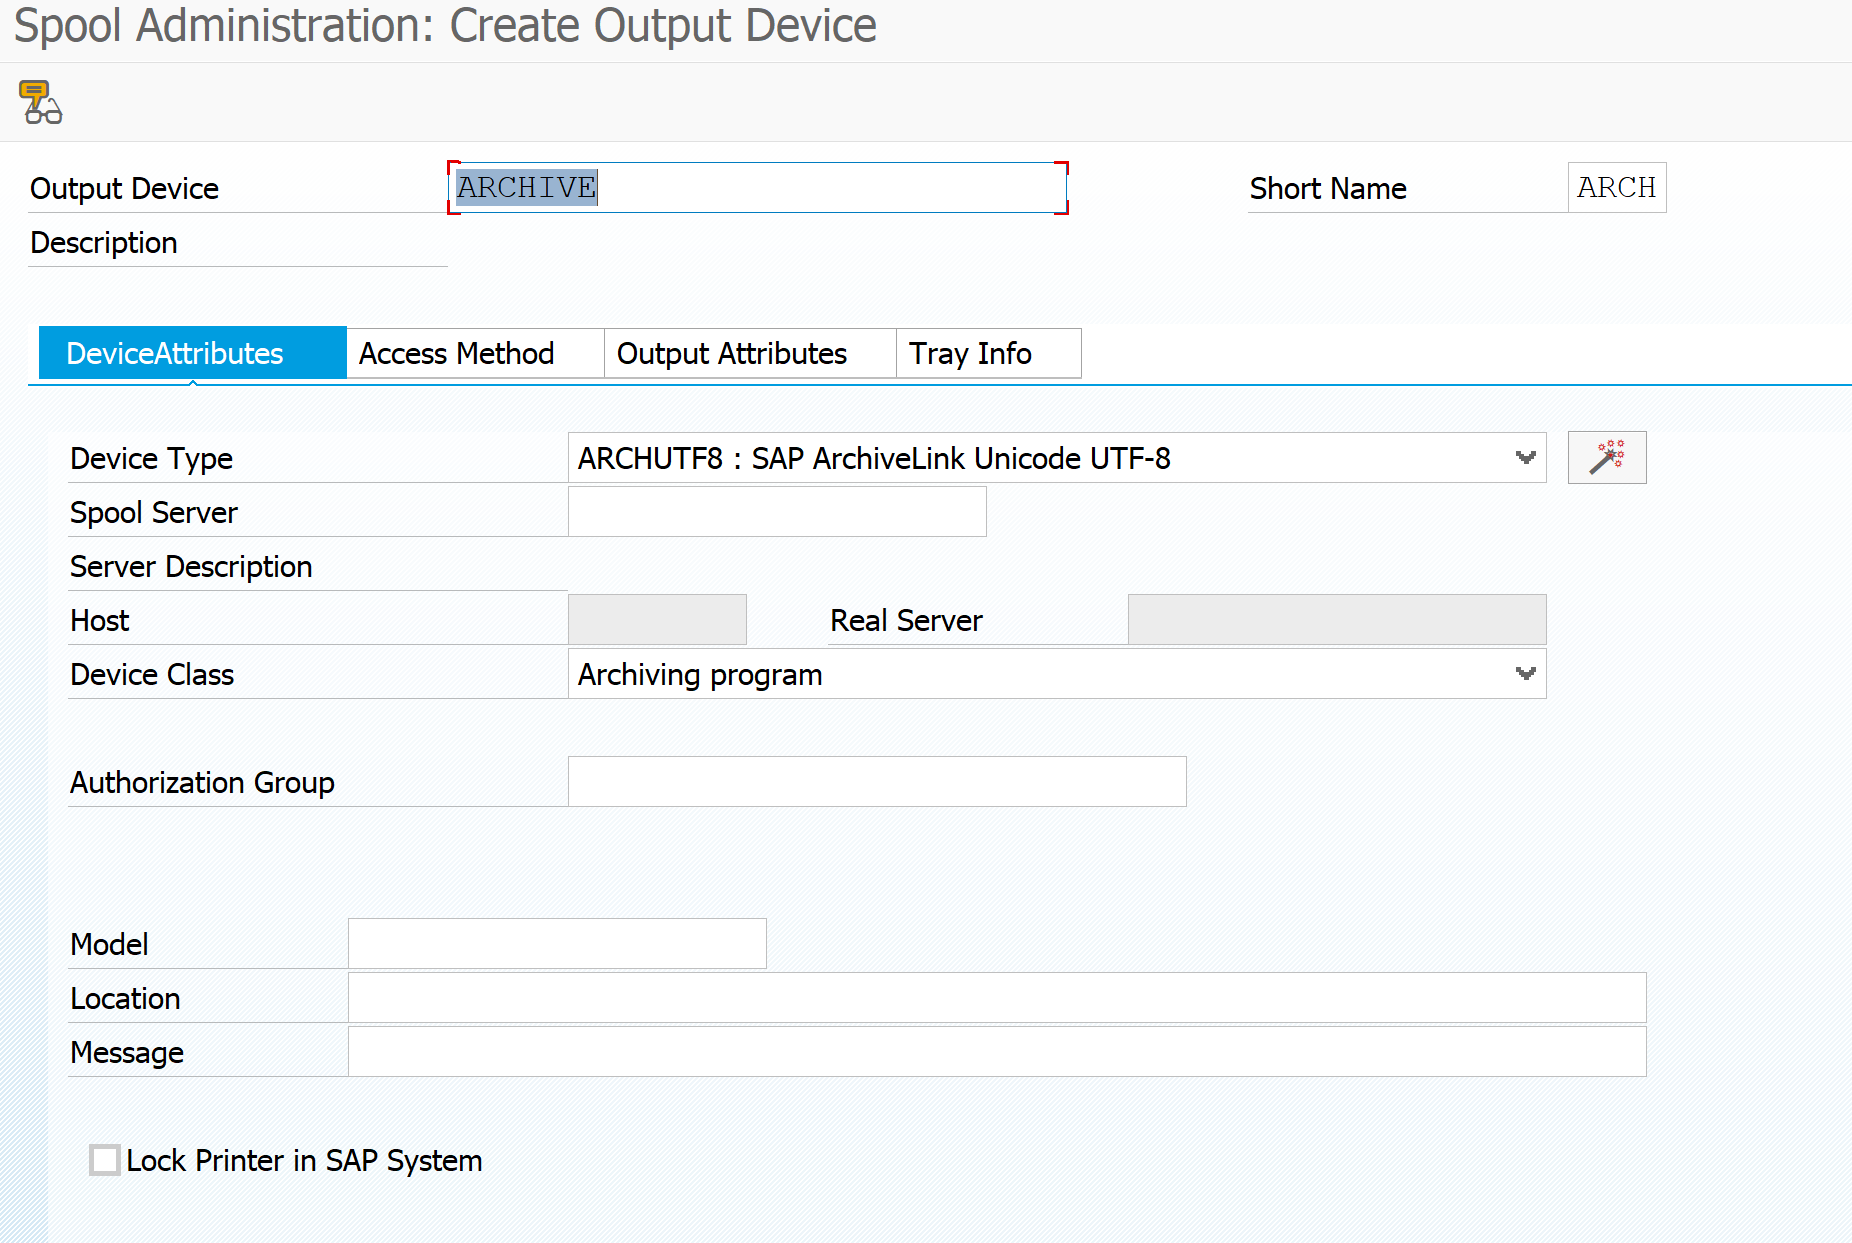
Final step is to setup the archive printer. You can later on see it with transaction SPAD as well.
Important here: short name must be ARCH. Device type and device class must be set to archiving.
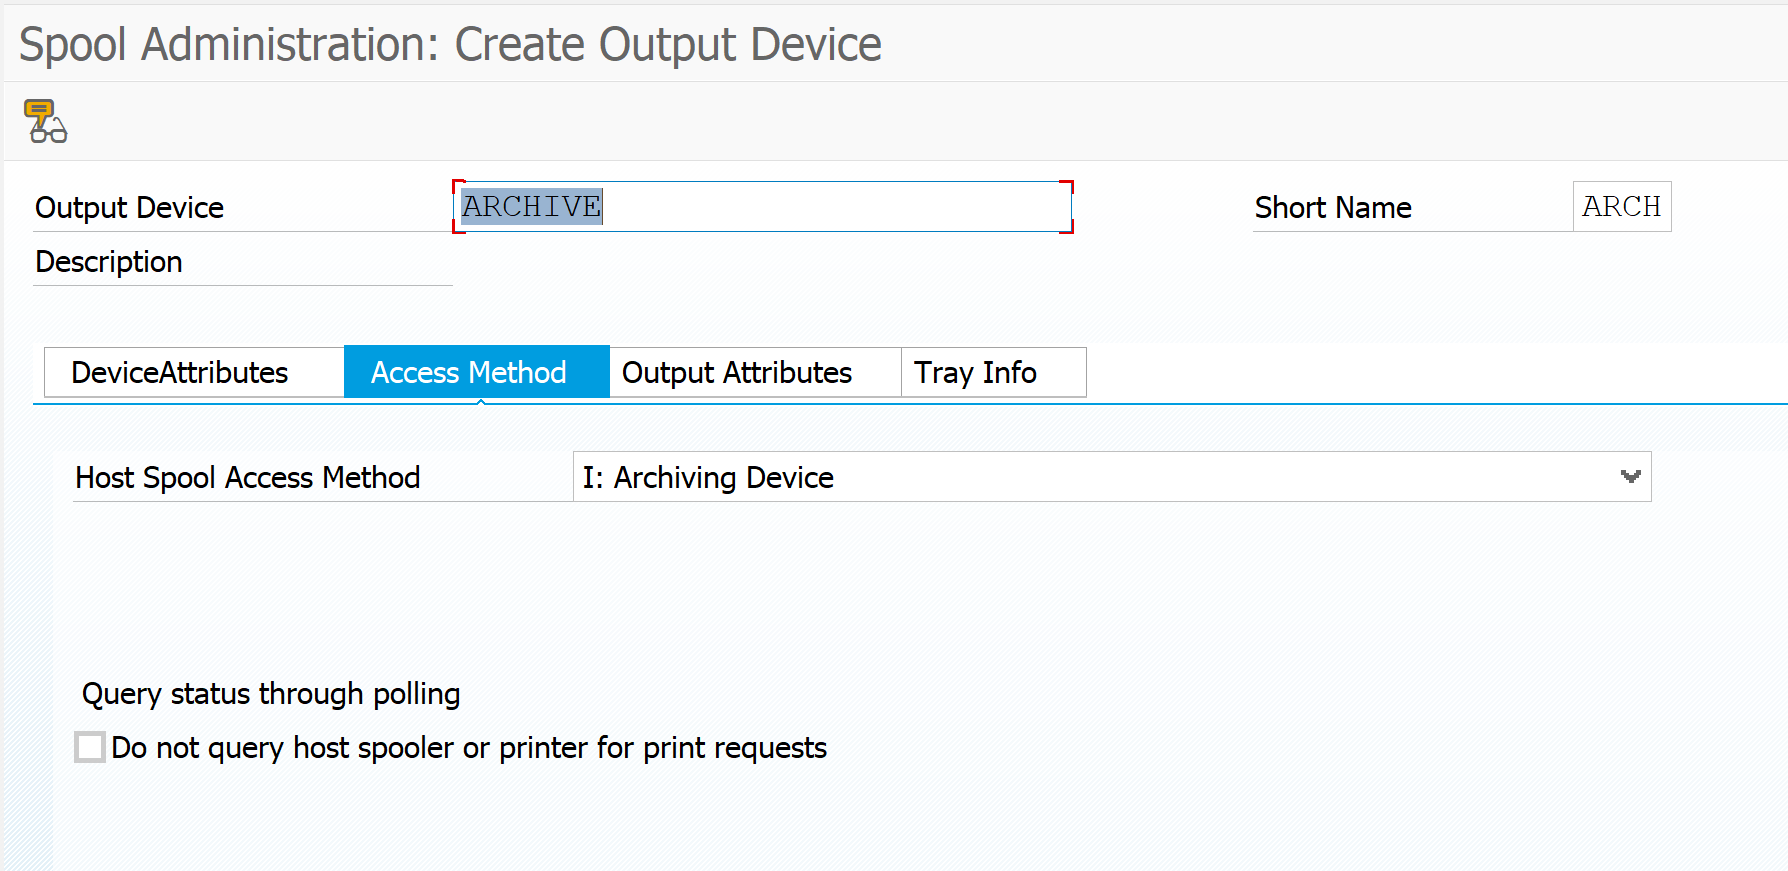
On the access method tab also set access method to archiving.
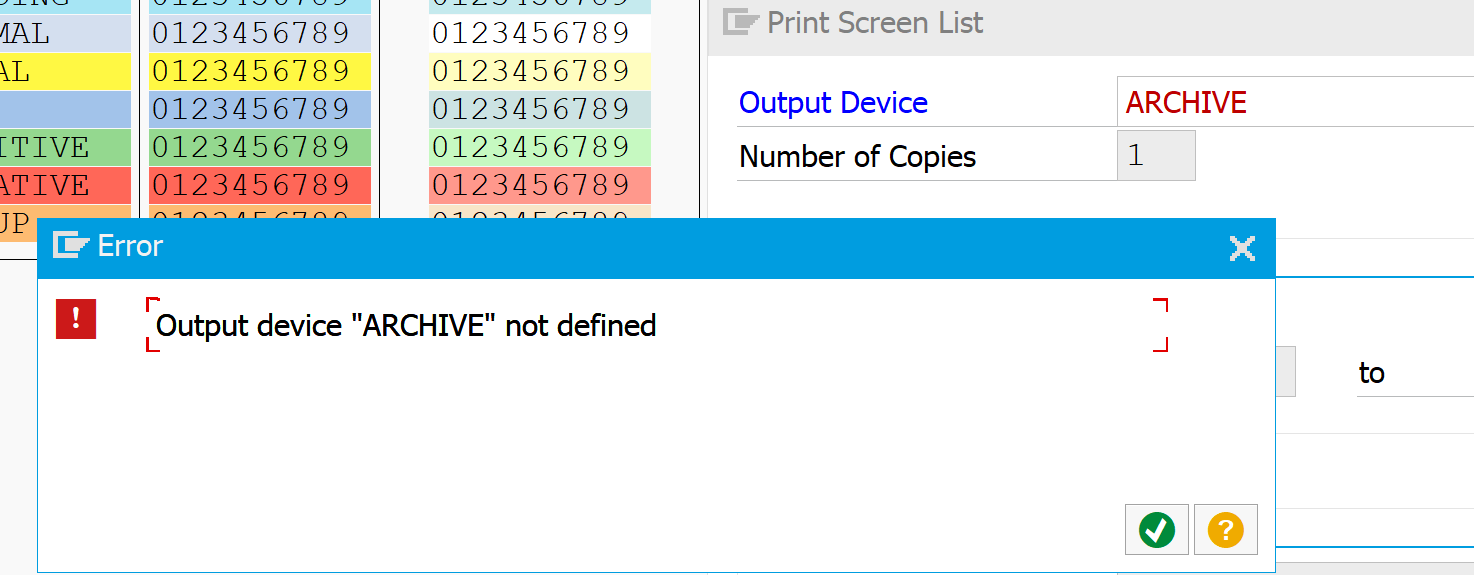
If you follow this procedure you will initially run into this strange screen:
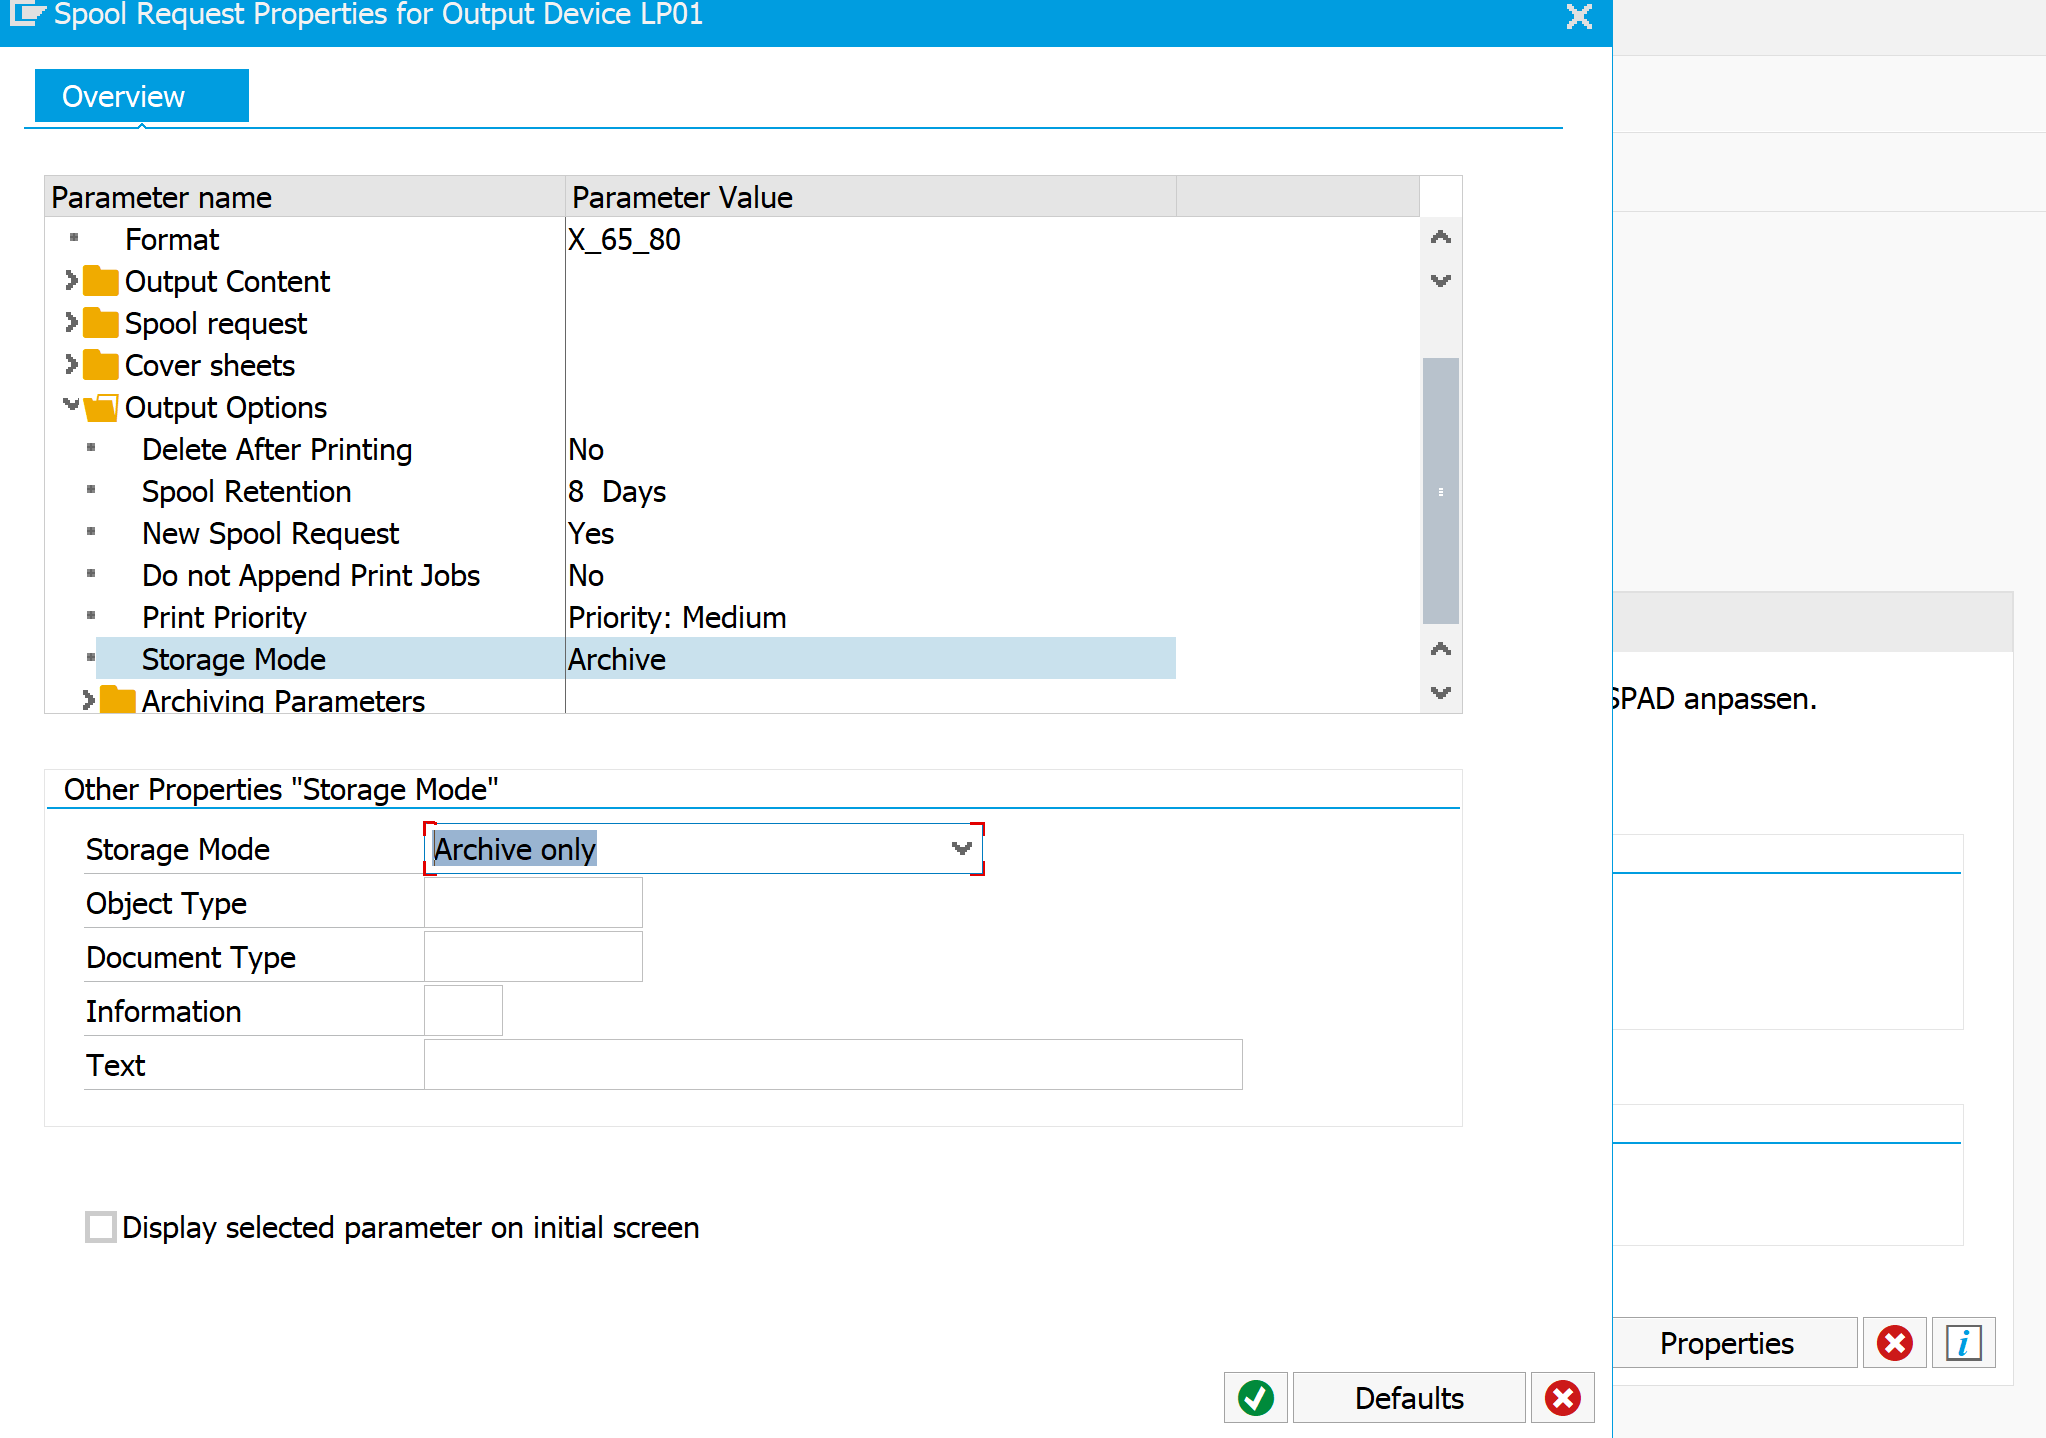
You didn’t do anything wrong yet. The problem is that the option for print to archive is not displayed by default. First go to the properties of a working printer to enable the archiving output option:
The rest of the note is self explaining:
Start SE38 and run program SHOWCOLO
Print the output list to printer ARCHIVE and archive mode selected
Goto SP01 find the spool, select menu path Print with changed parameters
Hit the Archive button
Start transaction OAM1 and hit the execute button next to Archive queue
Start transaction OADR to read from the archived print lists
From the list take the document and select the button “Display from storage system”
If you are having performance issues, of if you have done intensive data archiving or technical cleanup in your system running on Oracle, you need to consider the Oracle statistics. Without proper statistics the performance of your system will be sub-optimal or even bad.
Questions that will be answered in the blog are:
How to run Oracle index statistics update?
How to use the update as part of technical cleanup?
Oracle index statistics update
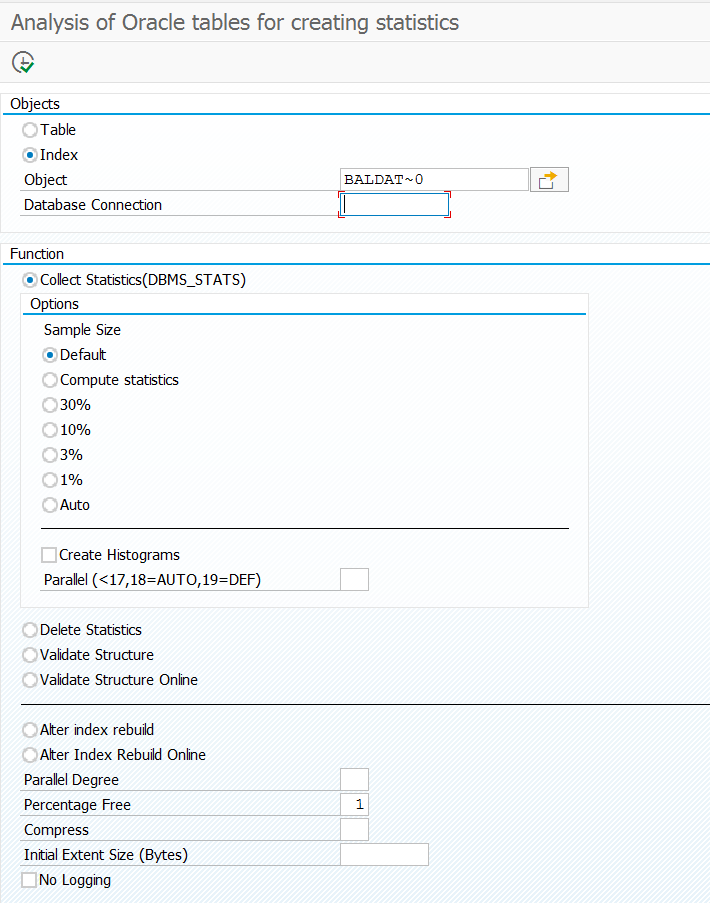
To run the Oracle index statistics update, go to transaction SE38 and start program RSANAORA:
To redo the statistics of an index fill out the table and index in the format: table~index. In this example the main index (0) of table BALDAT is chosen: BALDAT~0.
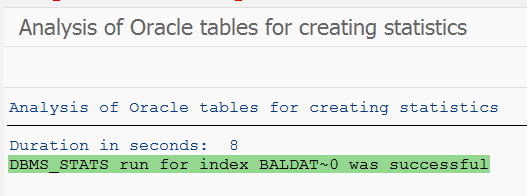
Run the update and wait for it to be finished:
Repeat this for every index defined in your system (lookup in SE11, button Indexes).
Runtime will depend on the amount of entries in the table and the type of infrastructure. Test on acceptance system before running in productive server.
Index run for almost empty tables
If your table is empty or almost empty you can also run RSANAORA with the option Alter index rebuild online. This will speed up read performance for that table index.
Regular runs
If you have setup regular technical clean up jobs as explained in this blog, you can opt to schedule a last step in the clean up job the update of the statistics program RSANAORA. This will ensure best performance while it will hardly cost you time.
The new solution has 2 locking transactions: SM01_DEV for client independent locking and SM01_CUS for client dependent locking.
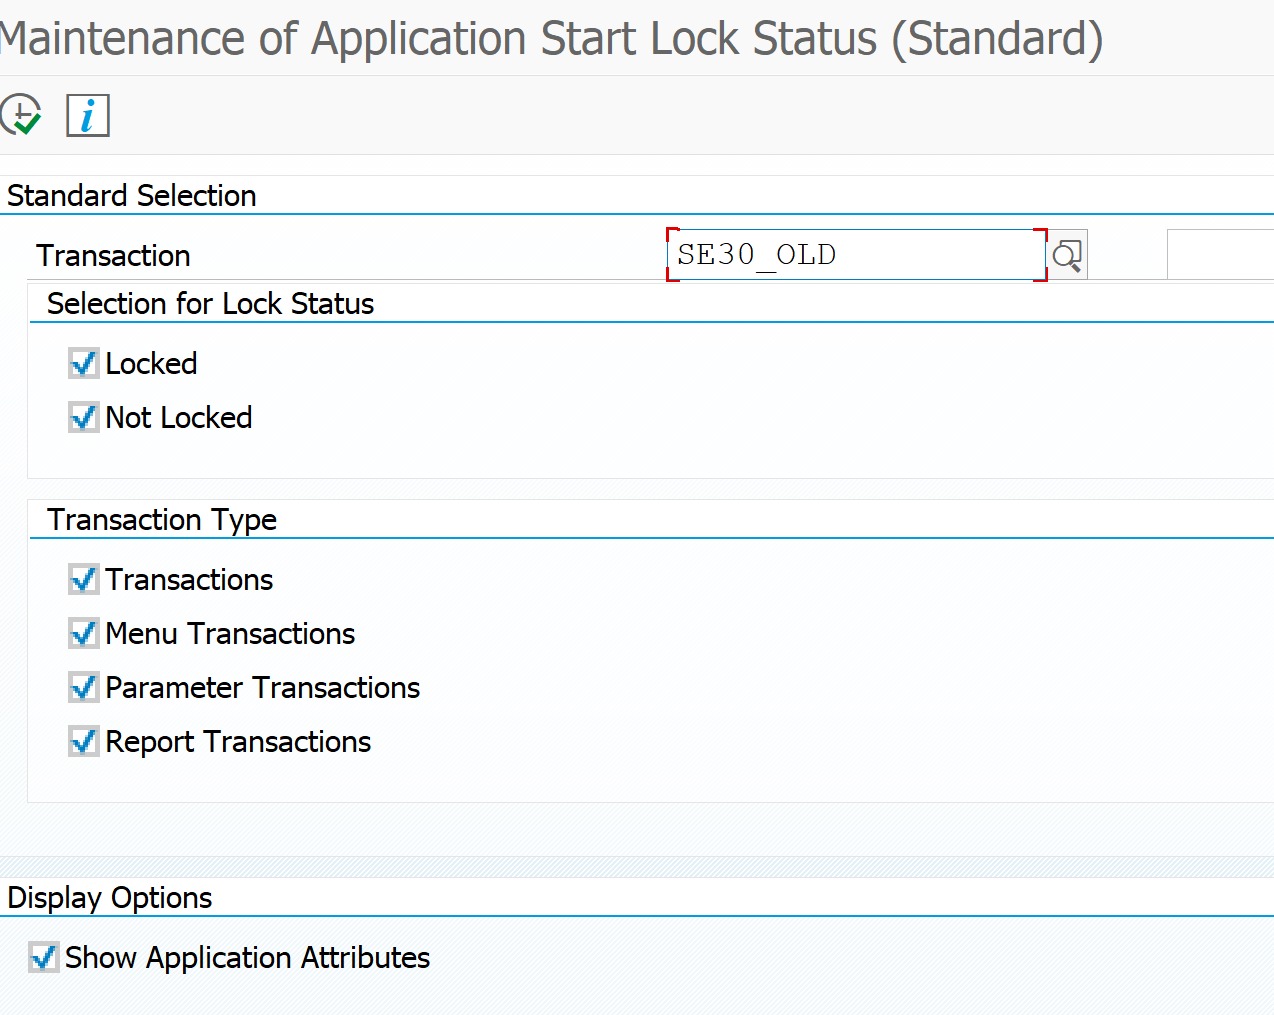
SM01_DEV locking transaction
Start tcode SM01_DEV:
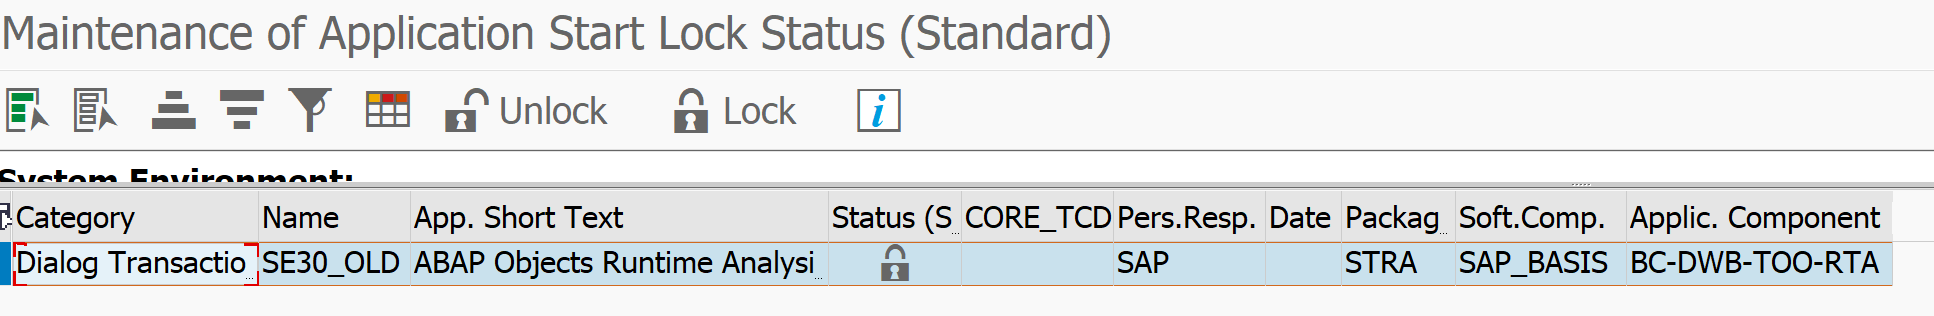
In this example we will lock transaction SE30_OLD. On the next screen select the transaction and press the lock button. Fill out the transport number. End result:
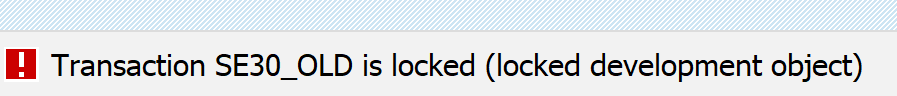
When starting SE30_OLD you now get this error message:
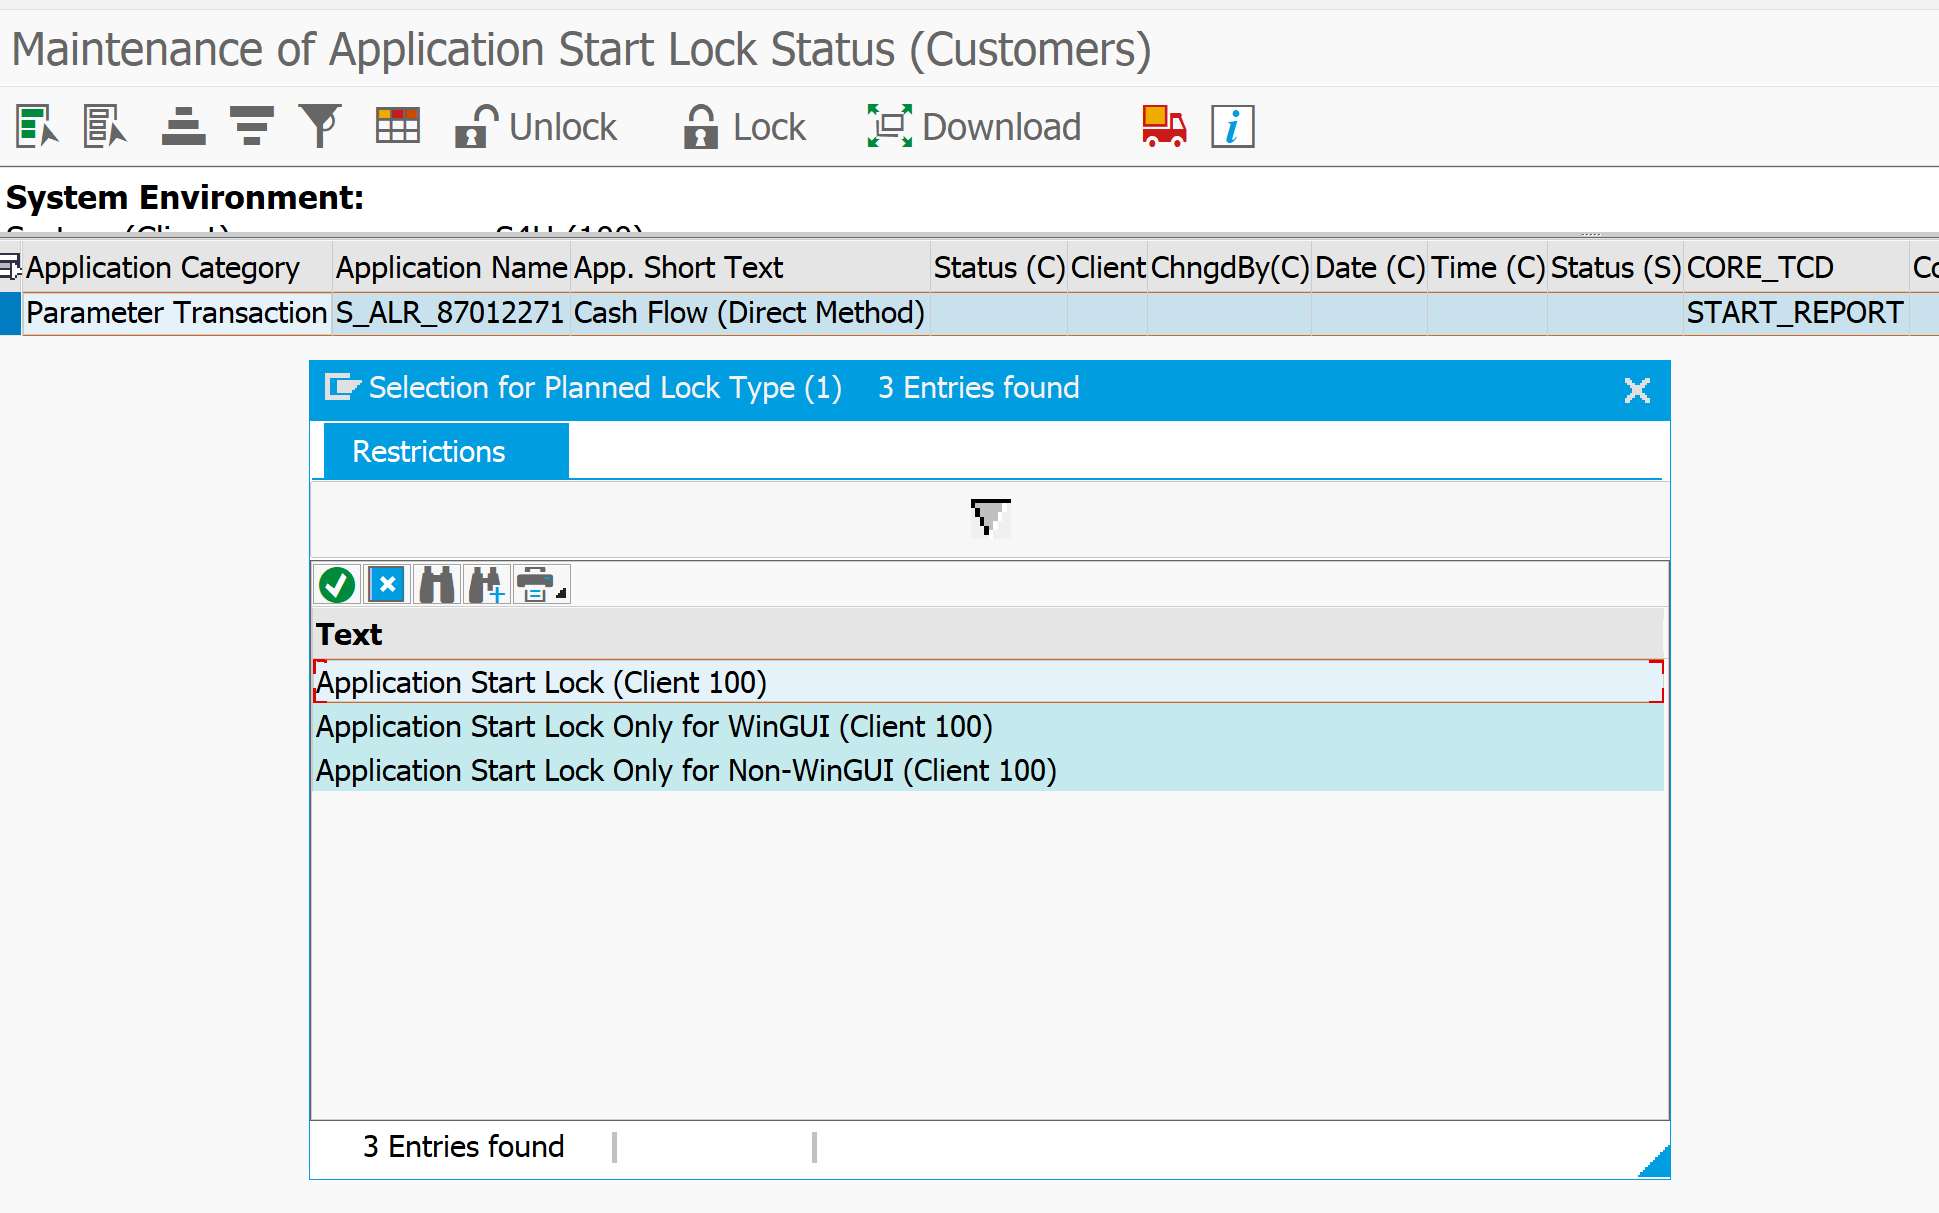
SM01_CUS locking transaction
In this example we want to lock transaction S_ALR_87012271. The start screen is identical to SM01_DEV. If you want to lock the transaction you get a popup screen in which you can differentiate for WinGui or non WinGUI.
The transaction will be locked, but not be put into a transport. If you want to transport the lock, you have to use the transport button.
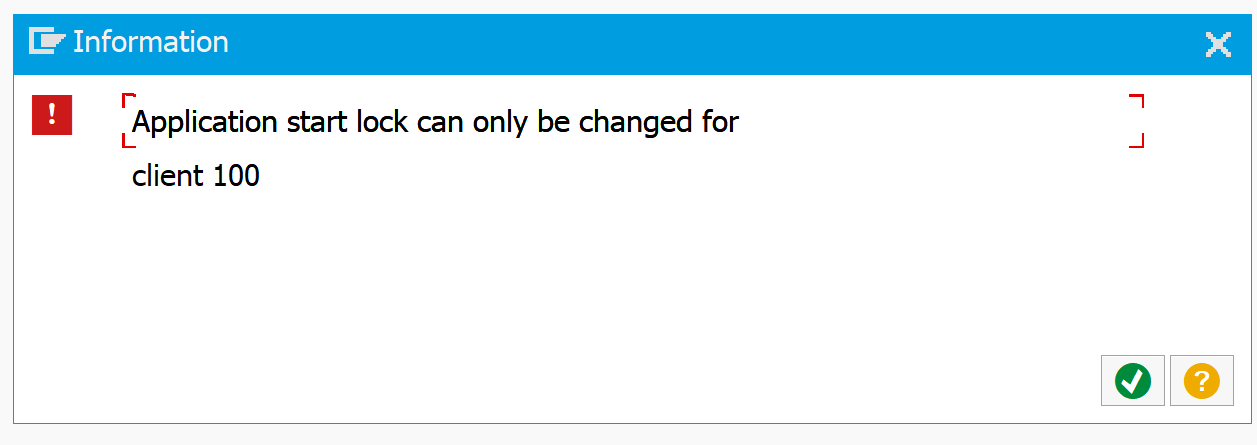
After locking tcode S_ALR_87012271 and starting it you get this message now:
The transaction is now only locked in the local client. If you have more client or want a full central lock, then you have to run SM01_CUS from client 000.
Differences SM01_DEV and SM01_CUS
Differences between the 2 transactions:
SM01_DEV locks global and has mandatory transport
SM01_CUS locks per client and has an optional feature to transport
Overview of locked transactions
Program RSAUDITC can be used to get an overview of all locked transactions.
This blog will explain the steps need to make the SAP workflow engine to work. If you have to set up the SAP workflow engine in S4HANA, please read this dedicated blog.
Questions that will be answered are:
How to execute the automatic workflow configuration?
What are common issues with workflow configuration?
How to test the automatic workflow configuration?
What other settings are to be done for custom workflow building?
Automatic workflow configuration
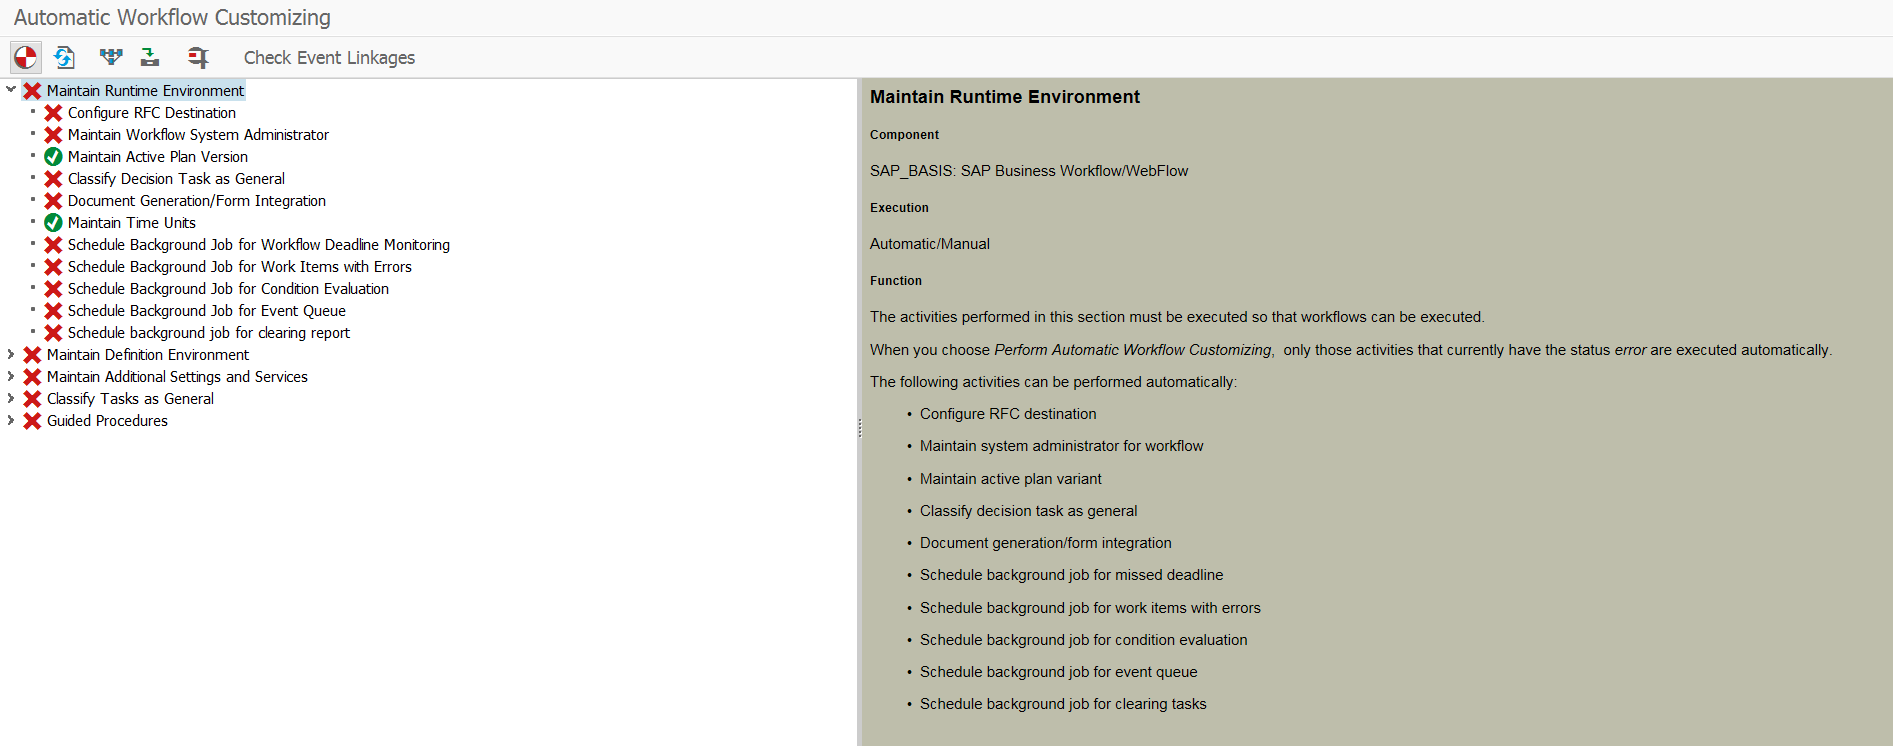
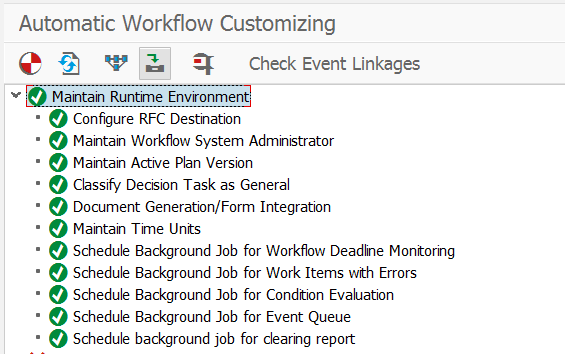
To setup workflow configuration start transaction SWU3. This brings you to the Automatic Workflow Customizing screen.
If the system is new then you see most of the icons are red. Hit the Automatic Customizing button.
Depending on your version all actions might be completed. In this step in the background the user WF-BATCH is created along with the RFC connection WORKFLOW_LOCAL_<CLIENT>.
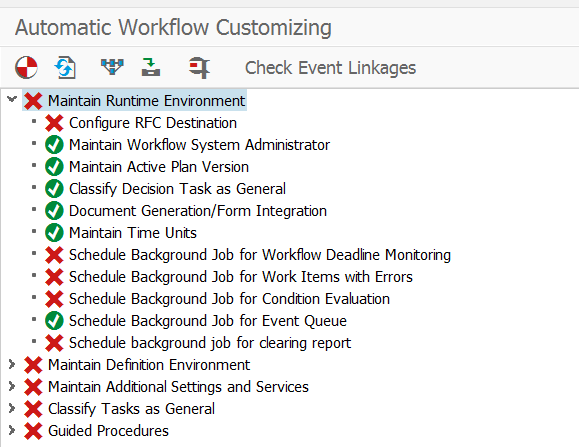
In the newer versions of SAP netweaver this automatic step might end up with this status:
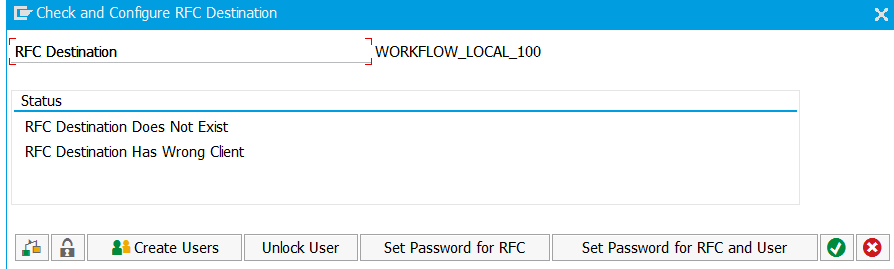
Zooming in on the RFC connection issue:
You will see as analysis that the user WF-BATCH is not yet created. In the newer SAP versions SAP expects you to create WF-BATCH first, before you run the automatic workflow configuration. If you have done the auto configuration and get this message, just create WF-BATCH user in SU01. Then restart SWU3 and repeat the step for automatic customizing. It will be correct:
Testing the workflow setup
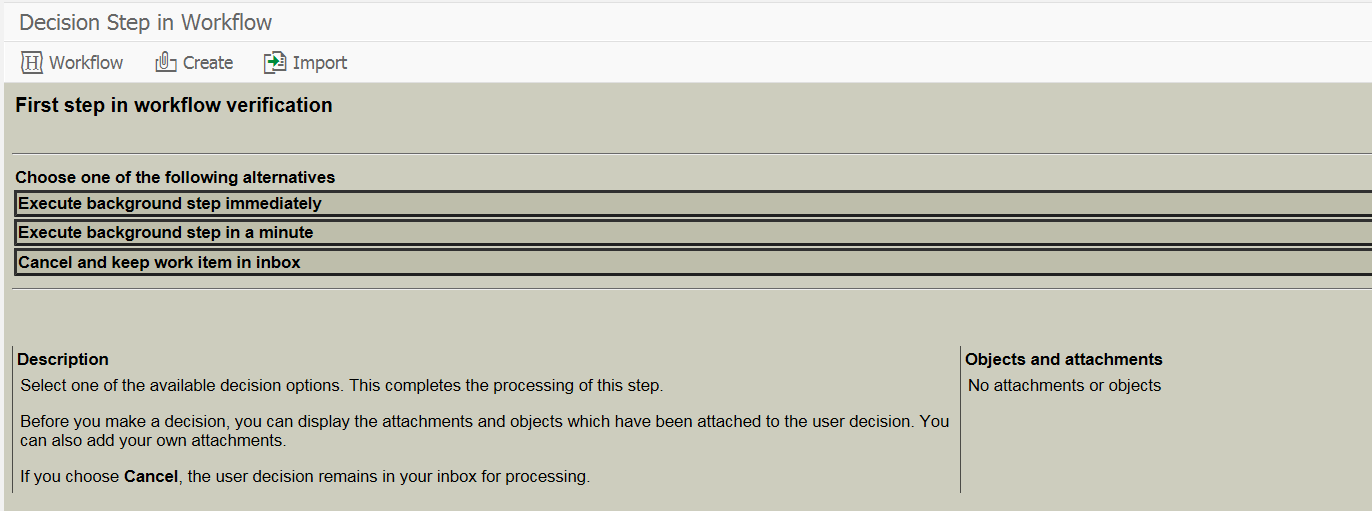
On the SWU3 screen hit the Start Verification Workflow button (if needed accept the event linkage activation). Be patient now for at least 5 minutes, since in the background normally a lot of code is compiling. Then go to the inbox to check if you validation workflow was properly launched. In S4HANA the button is no longer there on the SWU3 screen to jump to the inbox. You still can use the inbox button on the SAP start screen or use transaction code SBWP.
In the inbox you should see an item. Open it and make a decision:
This will end the verification.
Common issues
Most common issue is to execute the automatic customizing without sufficient authorizations.
Best practice from SAP basis: execute SWU3 directly after installation with SAP_ALL still attached to your user ID. Then only hand over the system to the authorization team. After activation, you can remove SAP_ALL and provide the authorizations as explained in OSS note 1574002 - WF-BATCH and SAP_WFRT Authorizations.
There are many static code analysis tools. Long list can be found on Wikipedia. At some point in time a manager or developer might come to you with one of these tools like “hey, at my previous customer we used SonarABAP for code measurements”.
This blog will explain the ABAP code metric tool built into netweaver. Together with the ATC tool the code metric tool covers most of the functions that such tools deliver.
Questions that will be answered in this blog are:
How can I count the amount of lines of Z code in my SAP system?
How to run ABAP code metric tool?
What output will the ABAP code metric tool deliver?
Use cases of the ABAP code metric tool?
Test program
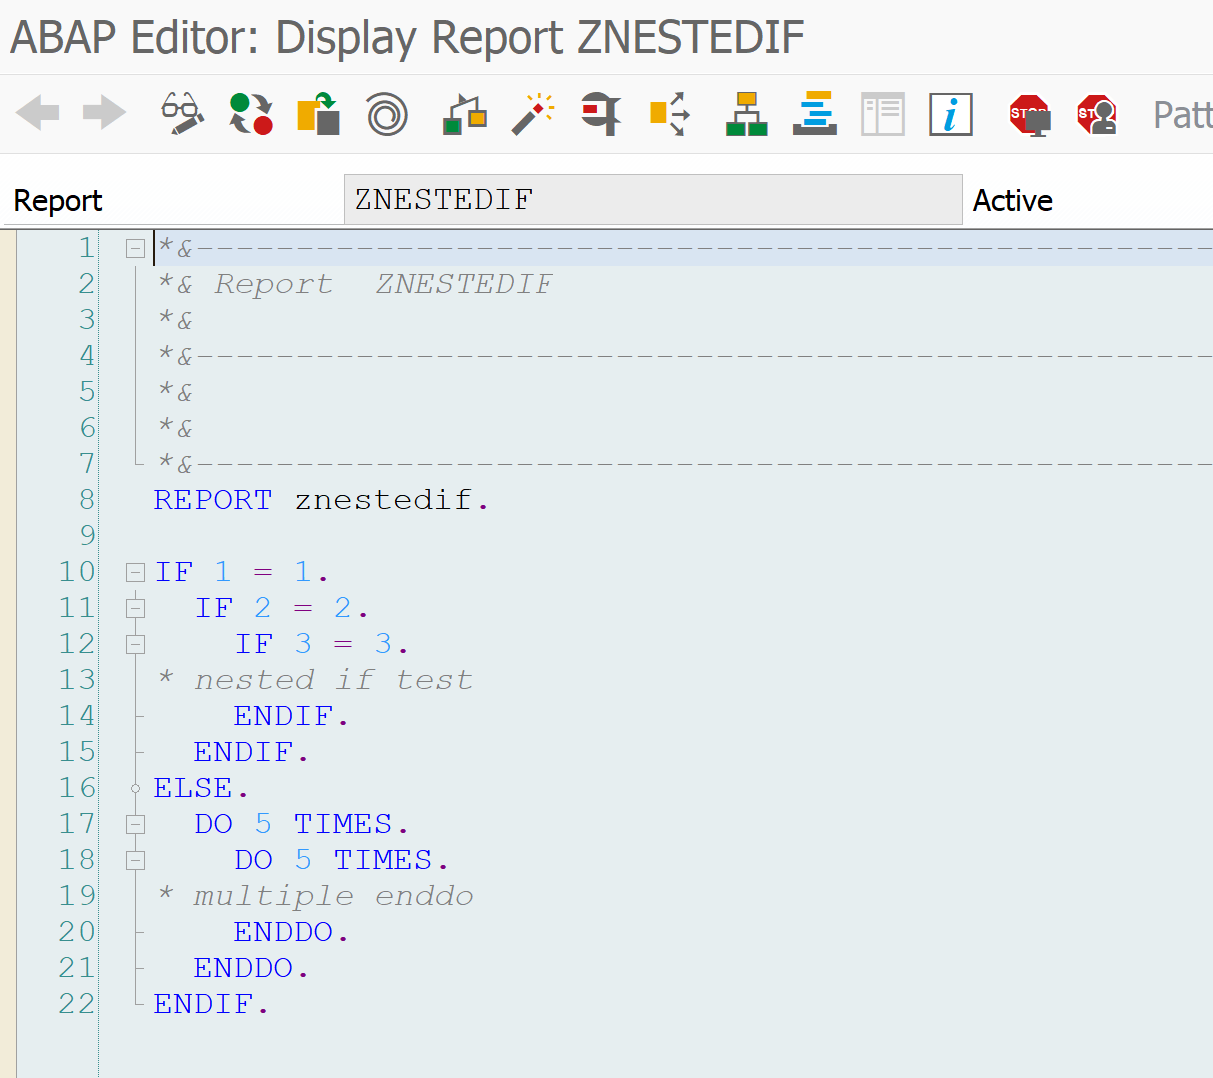
The test the code metric tool write a small ABAP program like this:
This program has nested IF statements (3 levels deep), one ELSE statement and a nested DO.
Code metric tool
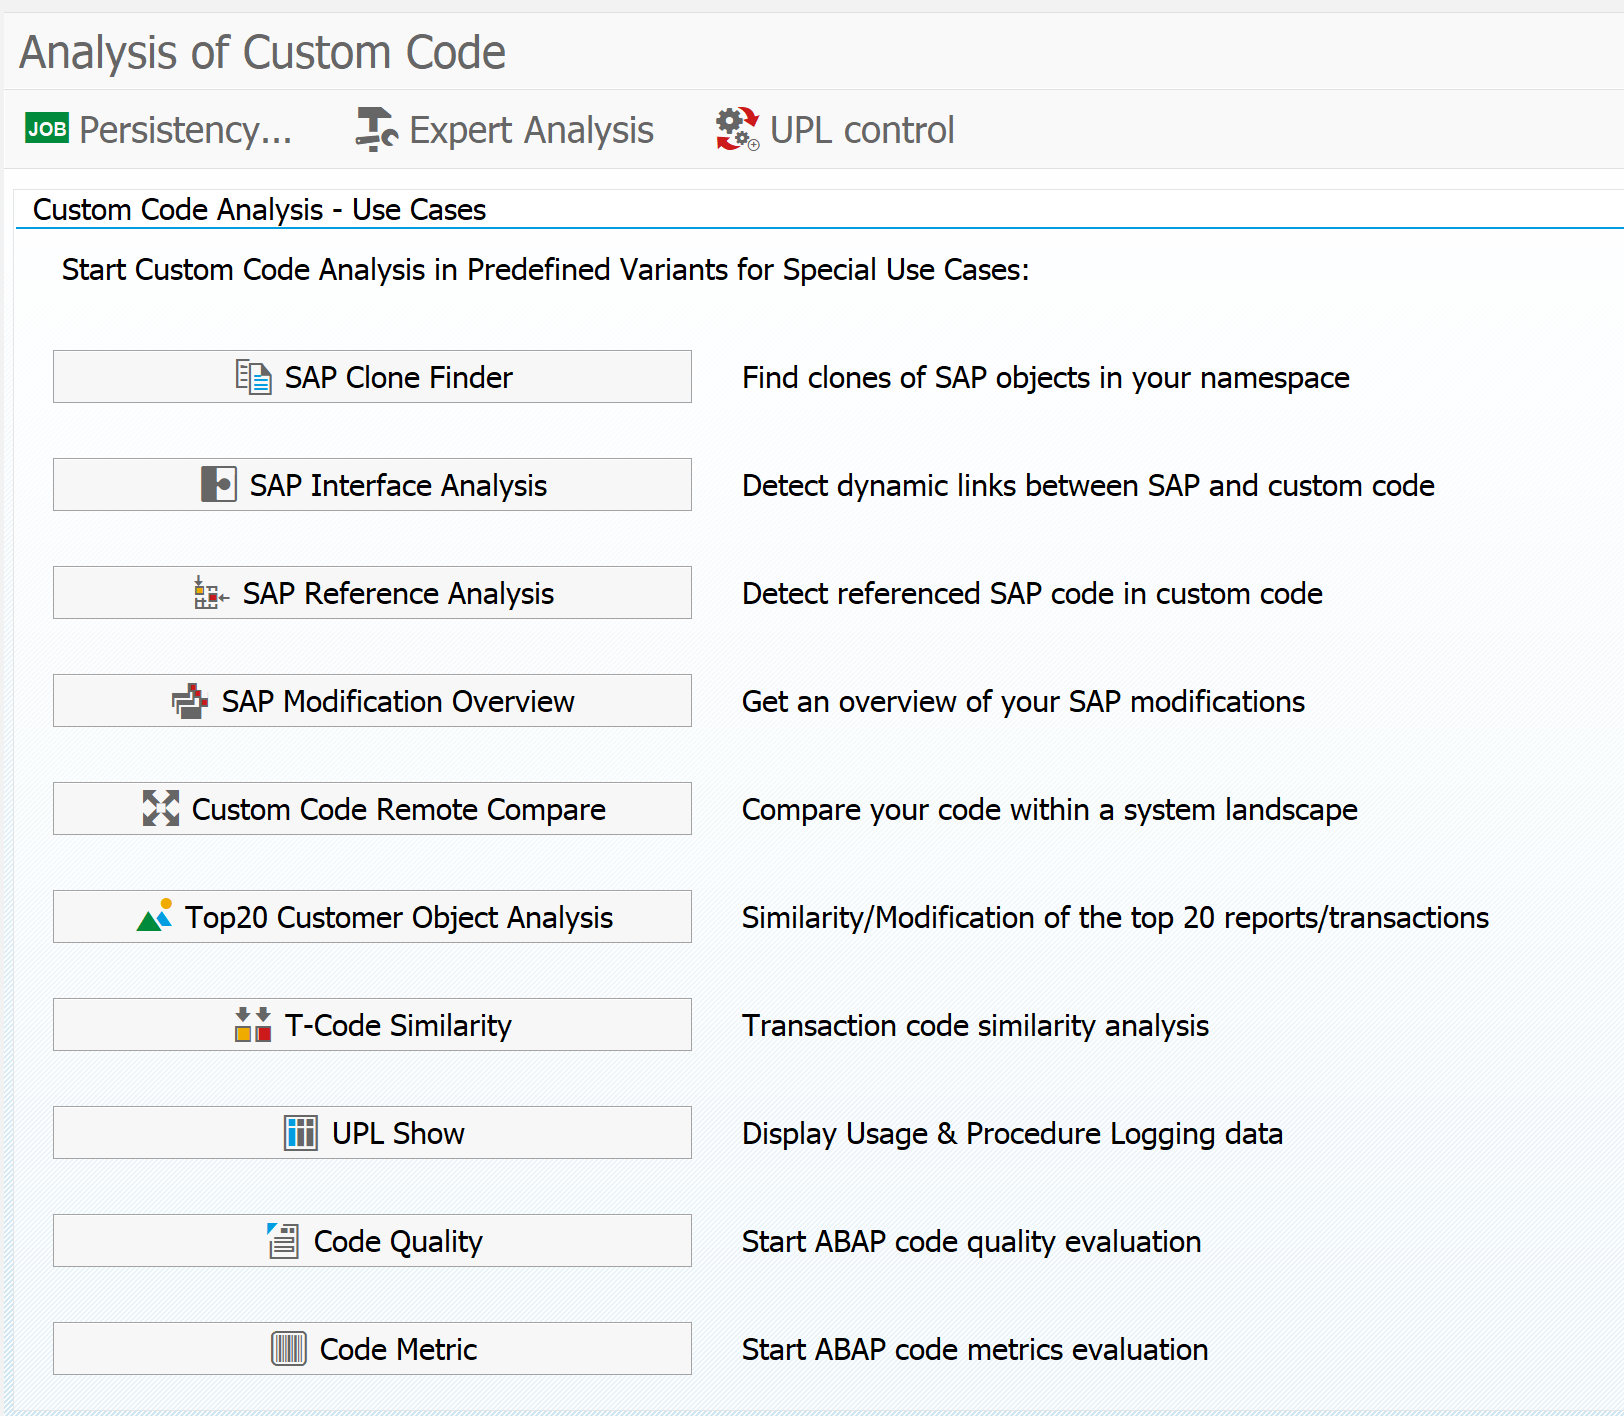
Start the custom code analysis tools with transaction /SDF/CD_CCA:
The code metric tool is the tool on the bottom of the screen.
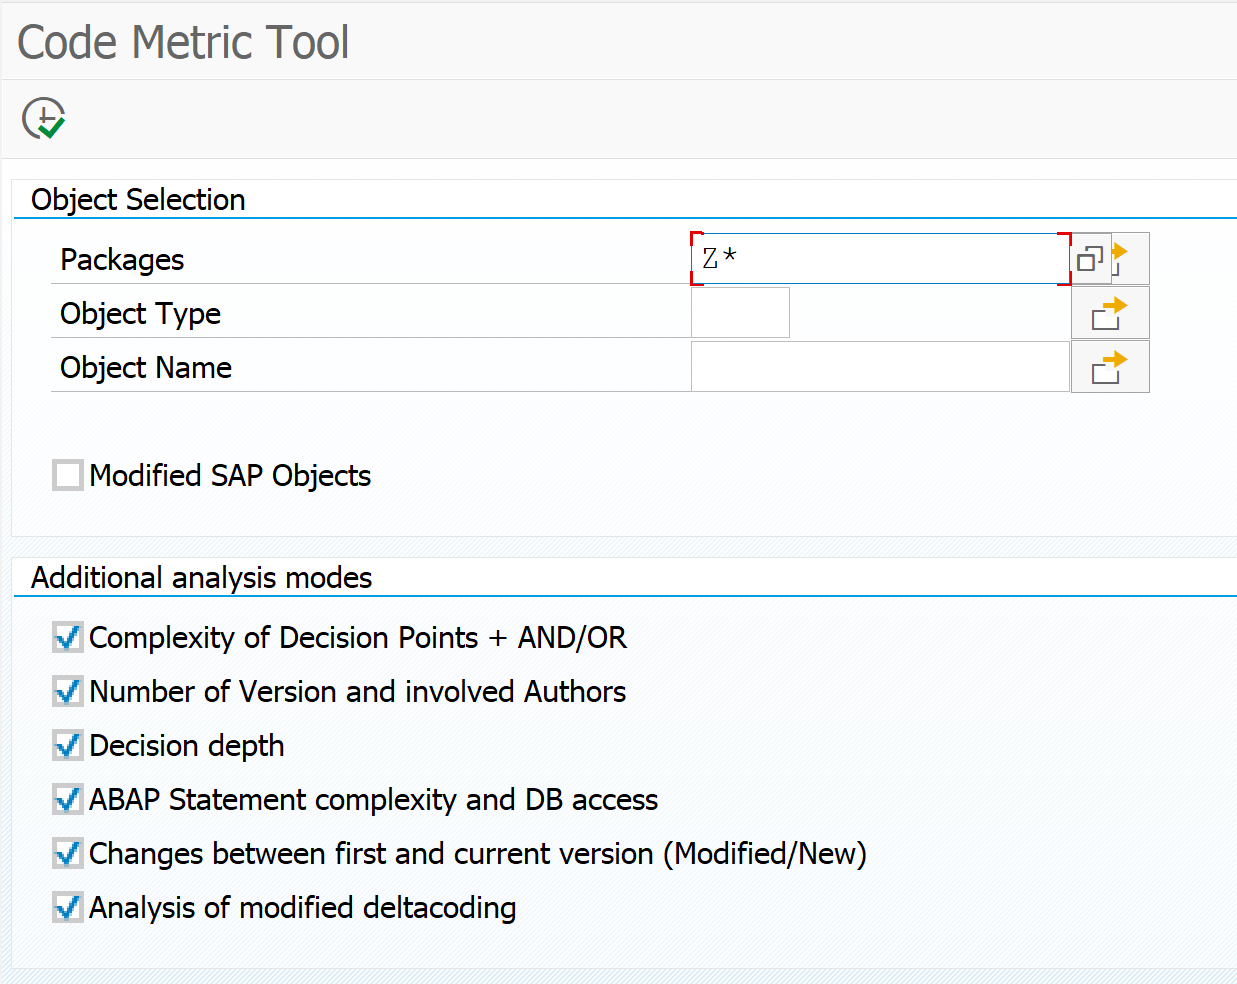
On the start screen select the package and extra checks (selecting more packages and checks will increase the runtime of the tool):
Result for our test program:
The output is giving:
LoC: lines of code
NoS: number of statements
NoC: number of comments
COM: complexity of conditions
TOTAL DD: complexity weighted by decision depth
etc
IF: 3 (this was in our test program)
ELSEIF: 1
DO: 2
etc like amount of loops, selects, updates, deletes, modifies, case statements.
Use cases of Code Metric Tool
Use case 1: complex programs
Complex programs are normally source of most productive issues. You can use the code tool to check if the program is not too overly complex (like many nested if and case statements).
Use case 2: the procedural versus OO discussion
Sometimes you have managers wanting you to count the amount of Z objects. If you have switched from procedural coding to OO coding you will find the amount of objects to have increased. The code metric tool can help you here by counting the amount of statements and complexity. The amount of objects in OO is typically higher, but due to re-use and better setup, the total amount of statements and the total complexity decision depth should be smaller.
Use case 3: count the amount of Z code lines in your SAP system
Every now and then there is discussion on Z code. Sometimes the question will popup: “How many lines of Z code do we have in our SAP system?”. This question you can answer as well with the code metric tool explained above.
For reference: SAP standard has 238 million lines of code (source is this SAP blog).
This blog will explain the use of SAP clone finder.
Questions that will be answered in the blog are:
What are clones?
How to run the clone finder tool?
How to analyze the difference between the original and the clone?
What are clones?
Standard SAP offers lot of out-of-the-box functions and reports. But in many cases the standard report only offers 95%. What to do? In many cases developers copy the standard SAP program to Z copy and add the needed 5%. When upgrading the system to higher version or when applying support packages or OSS notes, the Z clone will not be upgraded to latest version. Maybe the clone needs updates as well, or can be deleted now after upgrade (if SAP added the missing 5%).
The clone finder tool is able to find the clones made in the past.
When you are doing a S4HANA conversion project (see blog) you will have to look again at these clones if they are still relevant or not.
Running the clone finder tool
The clone finder is part of the Custom Code Analysis workbench. Start the workbench with transaction /SDF/CD_CCA or transaction CCAPPS:
Clone finder is on top of the list.
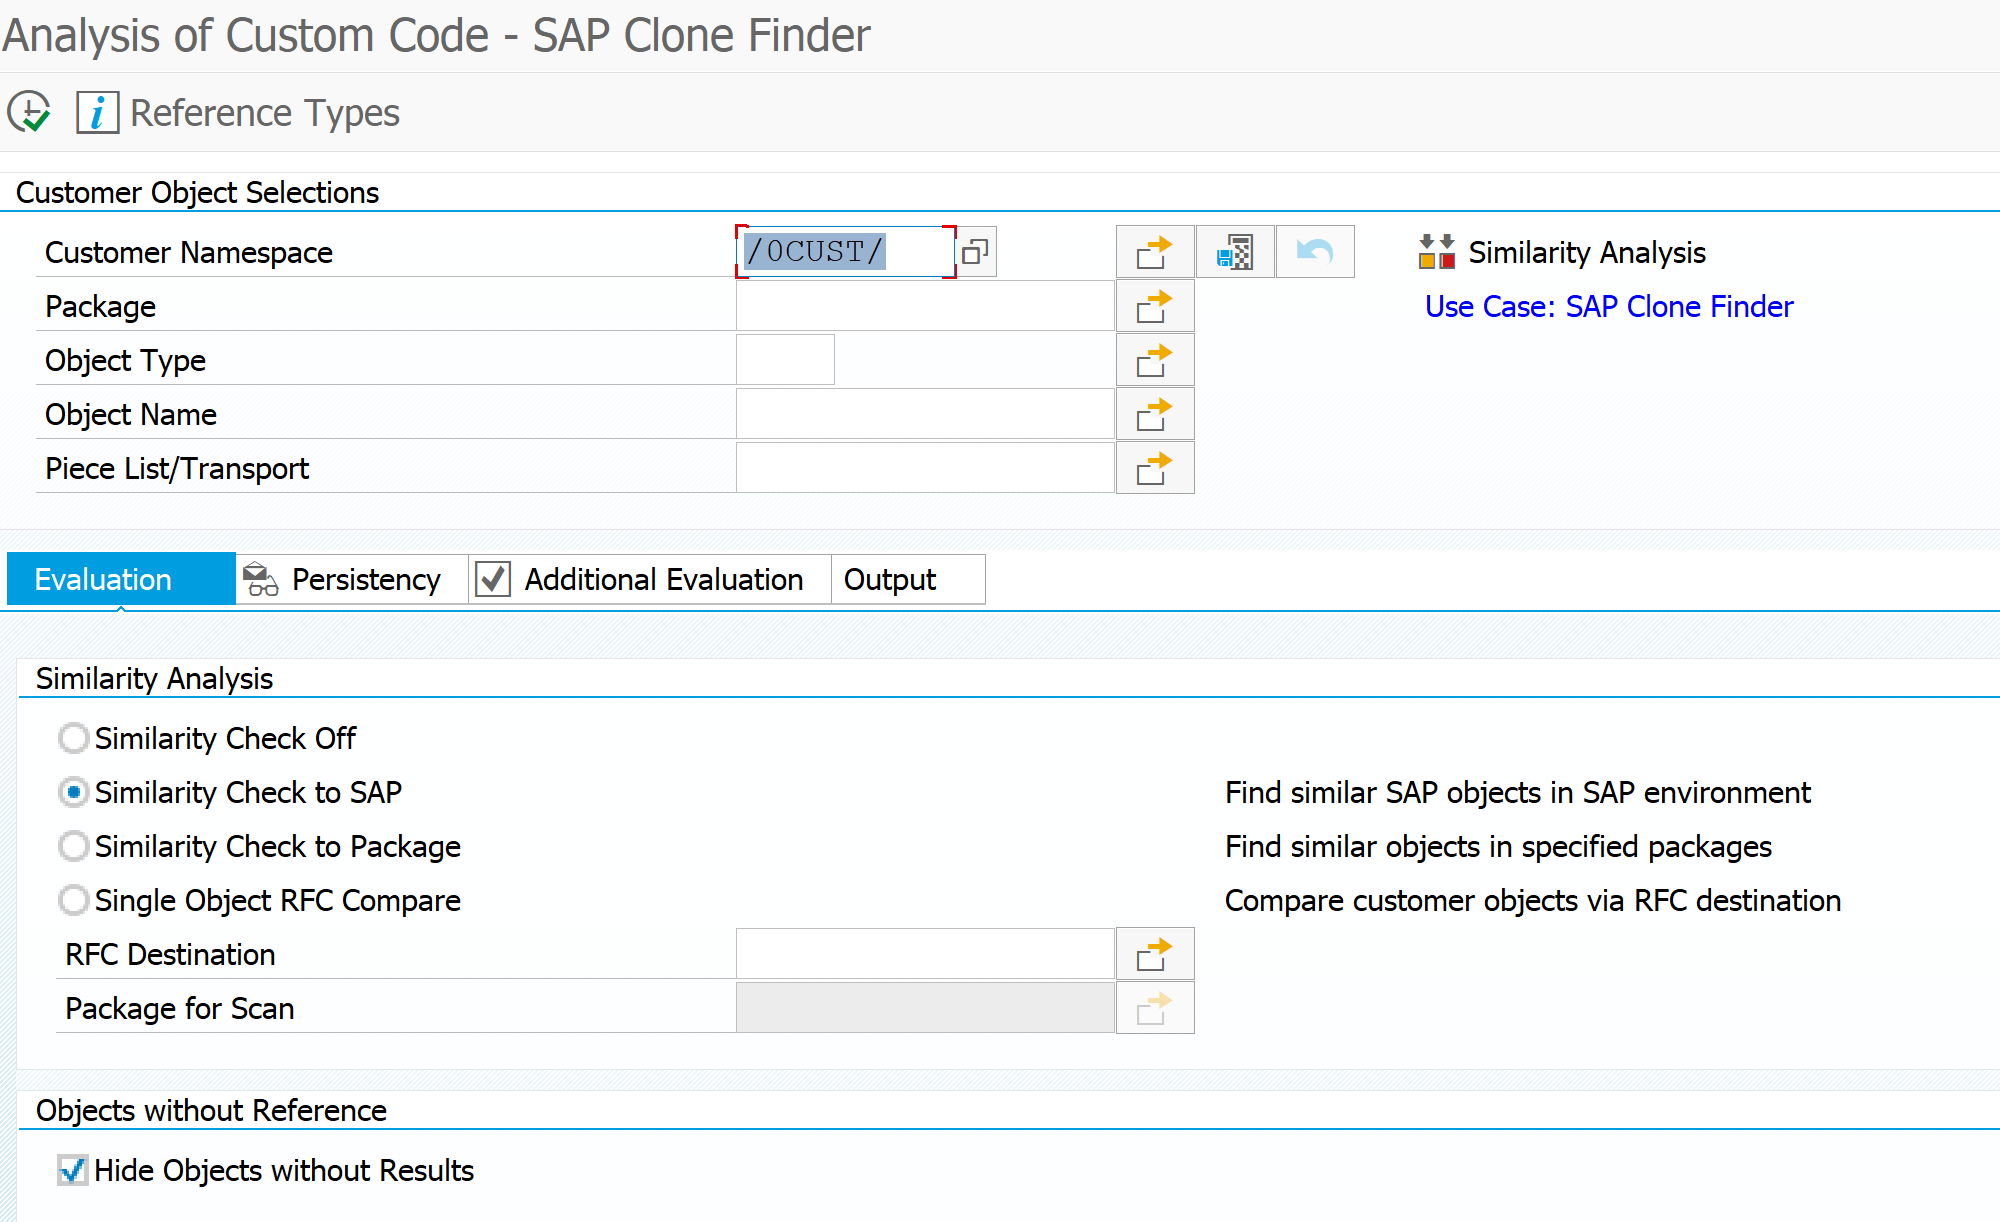
Start screen of clone finder:
Pending on the size of your system you can run online or in batch.
Test result of standard SAP copy made as example:
As example program RSUSR003 and its includes were copied to Z programs. 3 are shown as identical copies. 1 is altered.
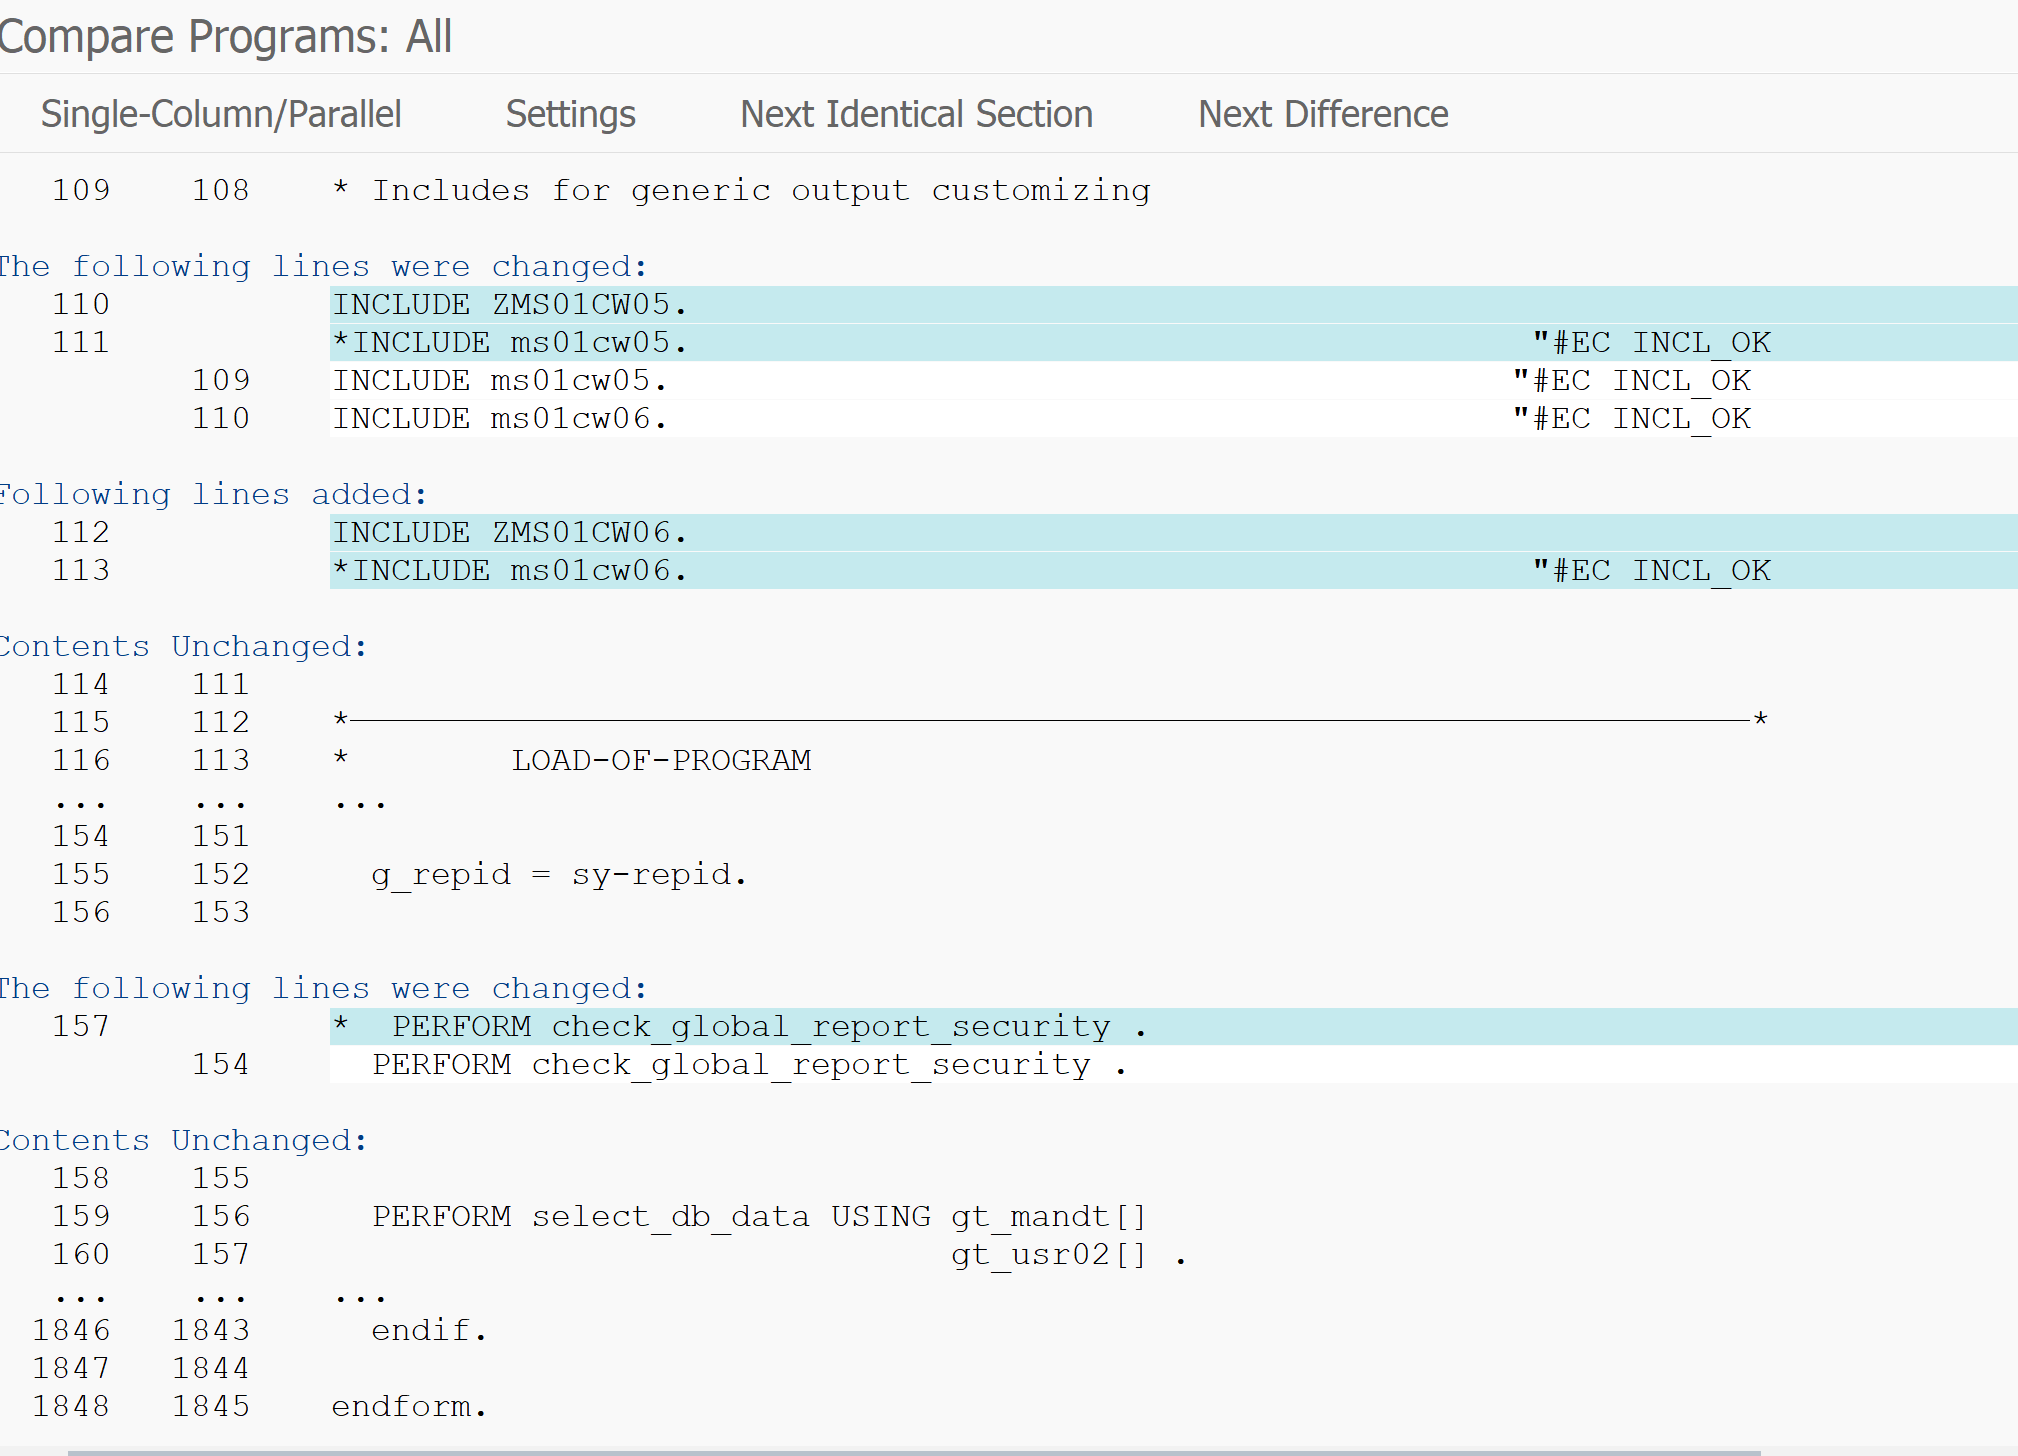
In the function link column you can hit the Version Compare button to see the differences:
Differences: the name of program and includes are different. And the authorization check was removed.
How to use changes in operation mode during runtime issues?
Operation modes explanation
In SM50 you can see the overview of work processes (in SM66 for all servers if you have more). The work processes are divided into online DIA, background BTC, update UPD, etc. The number of work processes is limited. During a working day normally more dialog processes are need for end-user usage. During the night typically more background batches are running.
This is where the operation modes come into the picture: you can setup these different modes and assign them to a timetable. The system will then have for example less dialog and more batch processes available during the night.
Operation modes setup
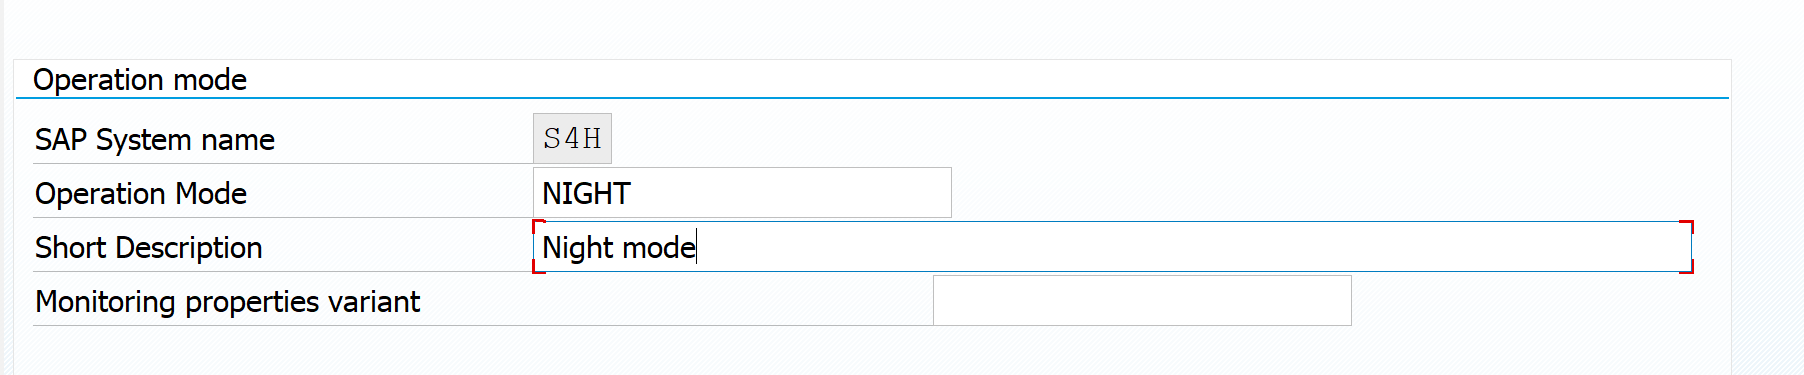
Start transaction code RZ04 for setting up the operation modes screen. Hit the create operation mode button:
Give a short key name and description for the operation mode. In our example we will set up simple DAY and NIGHT.
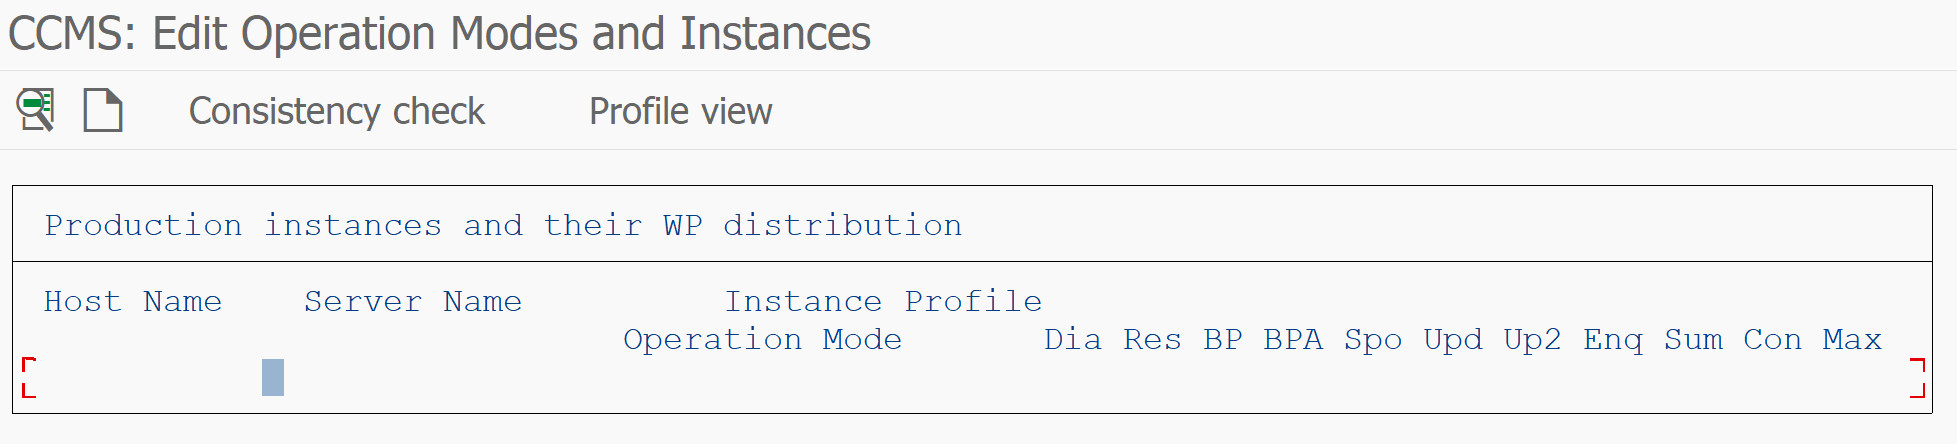
The initial screen after creation is empty:
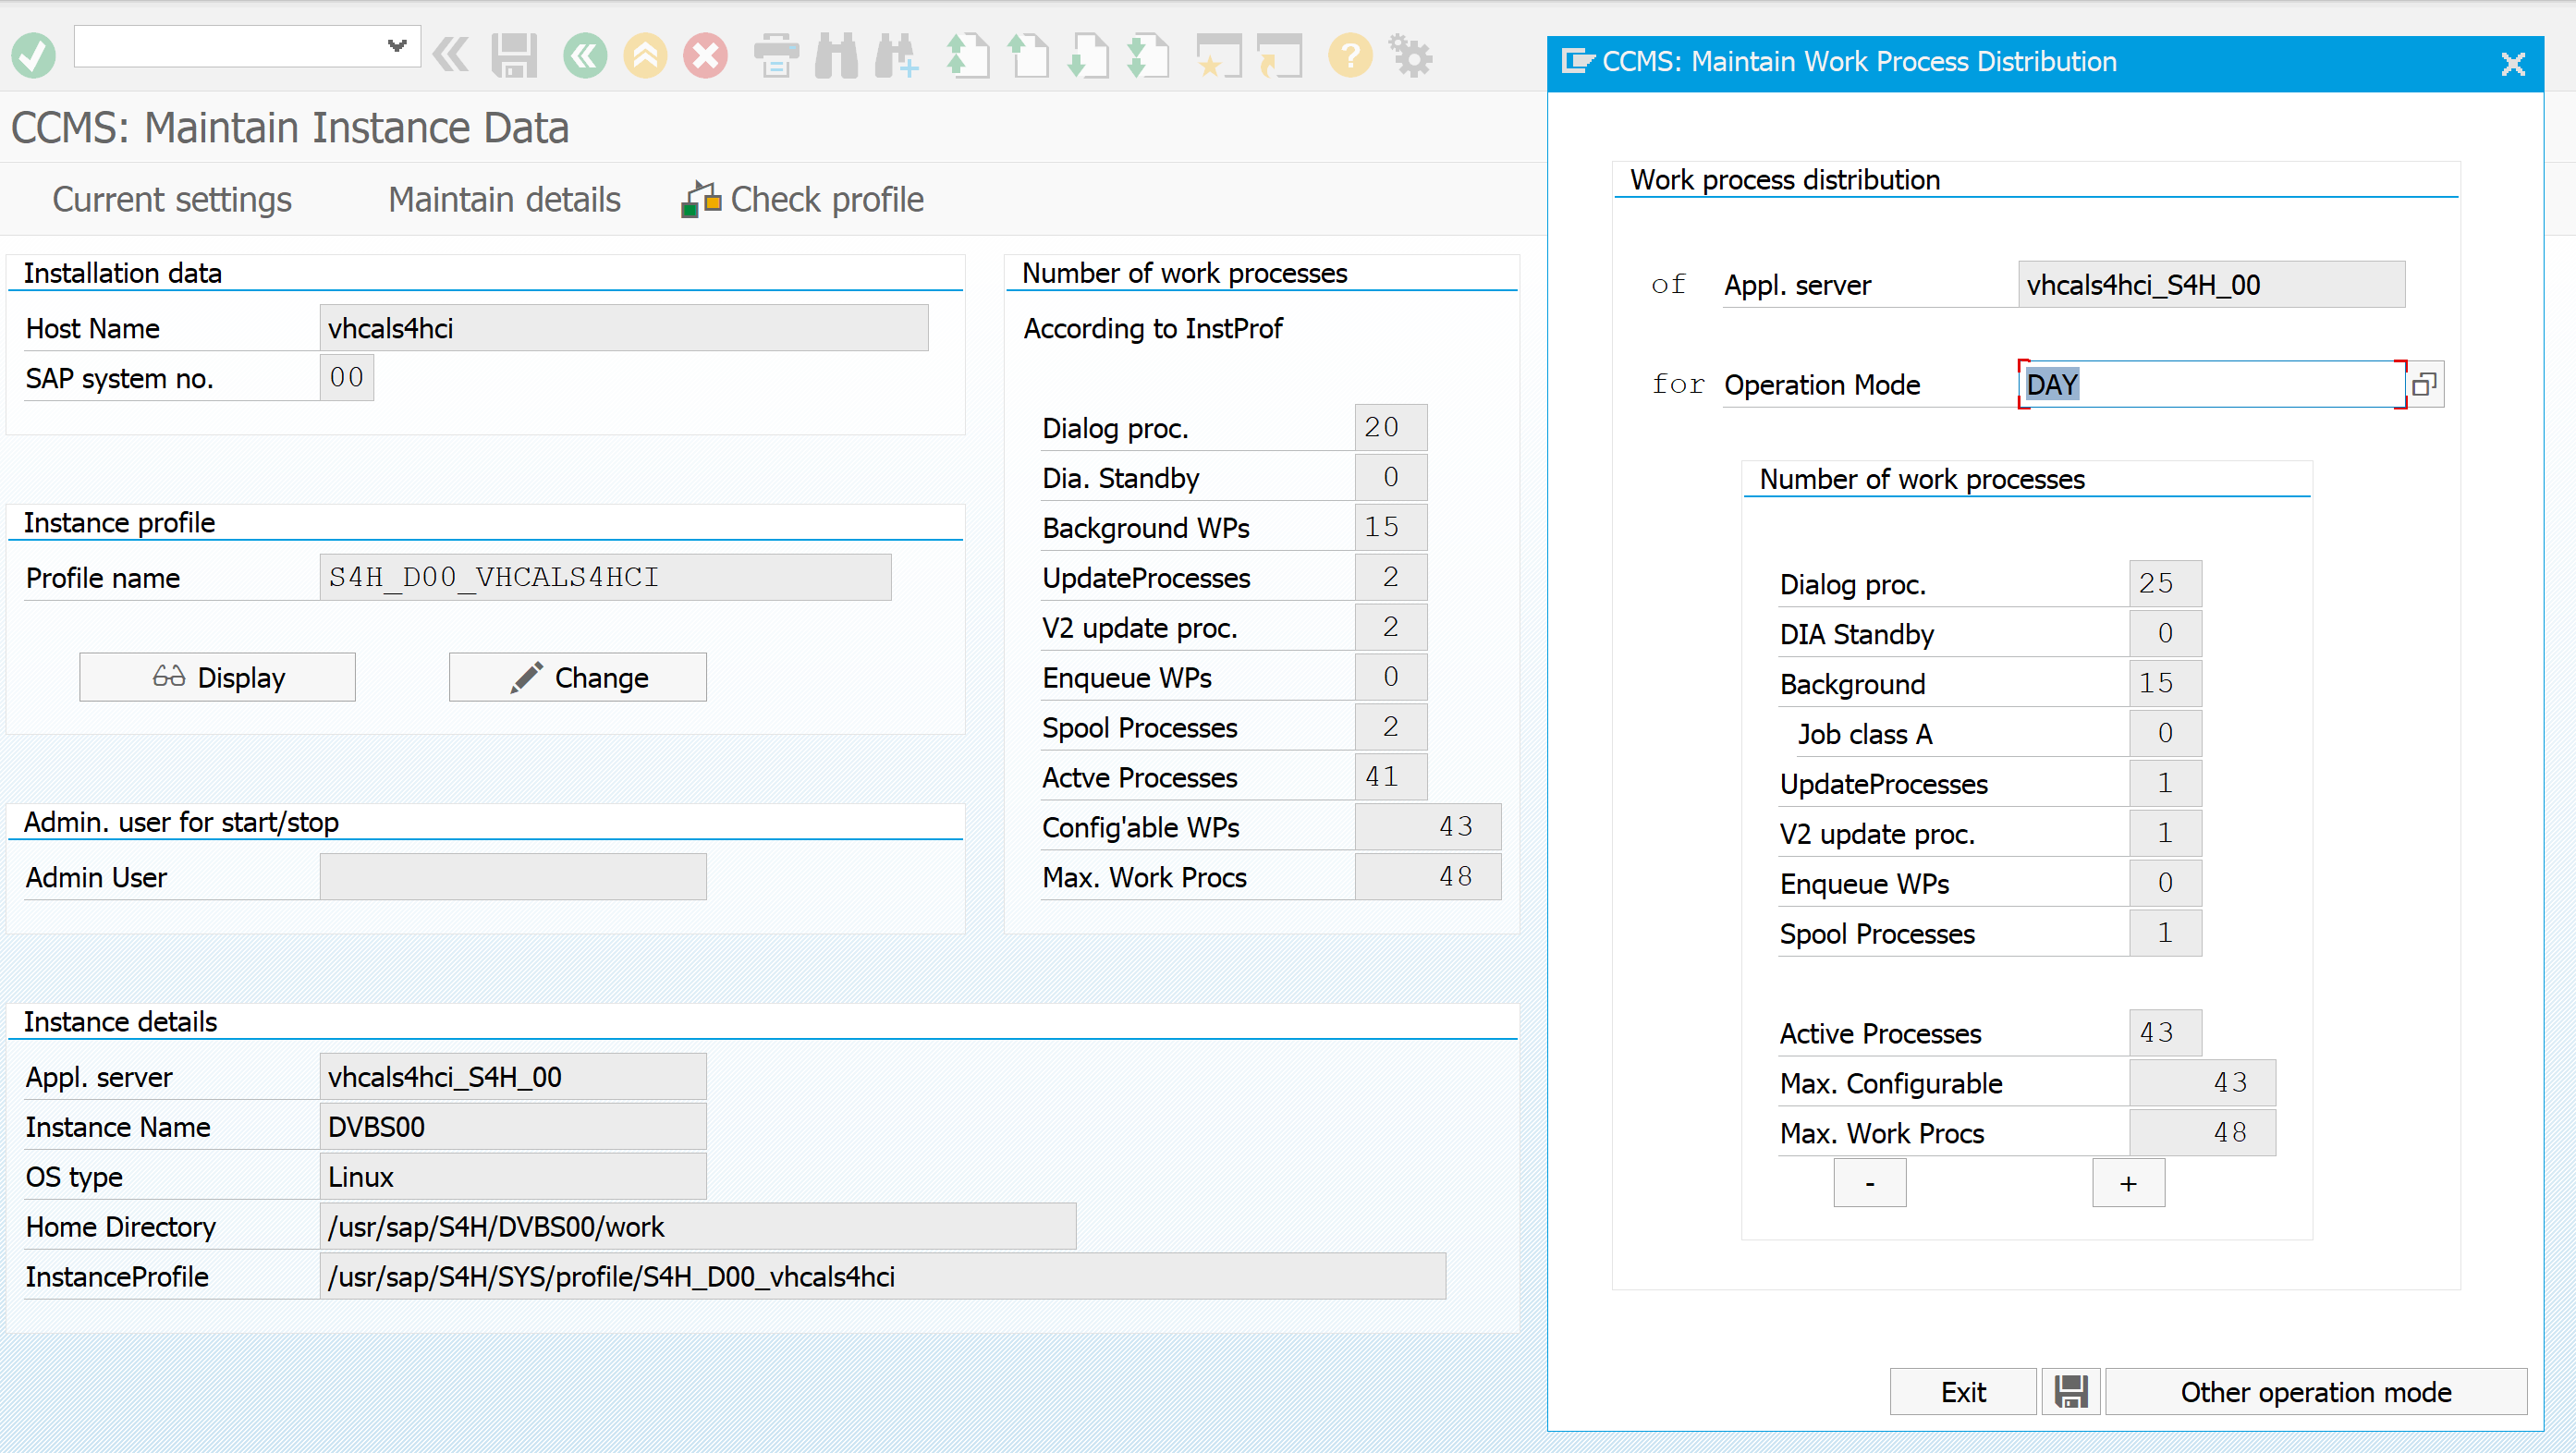
You now need to maintain the instance data and assign the created operation modes:
It is import to check if this is active or not. When in doubt select the menu Instance and entry Set to active.
Also in these screens: press the save button locally and on the top of the screen.
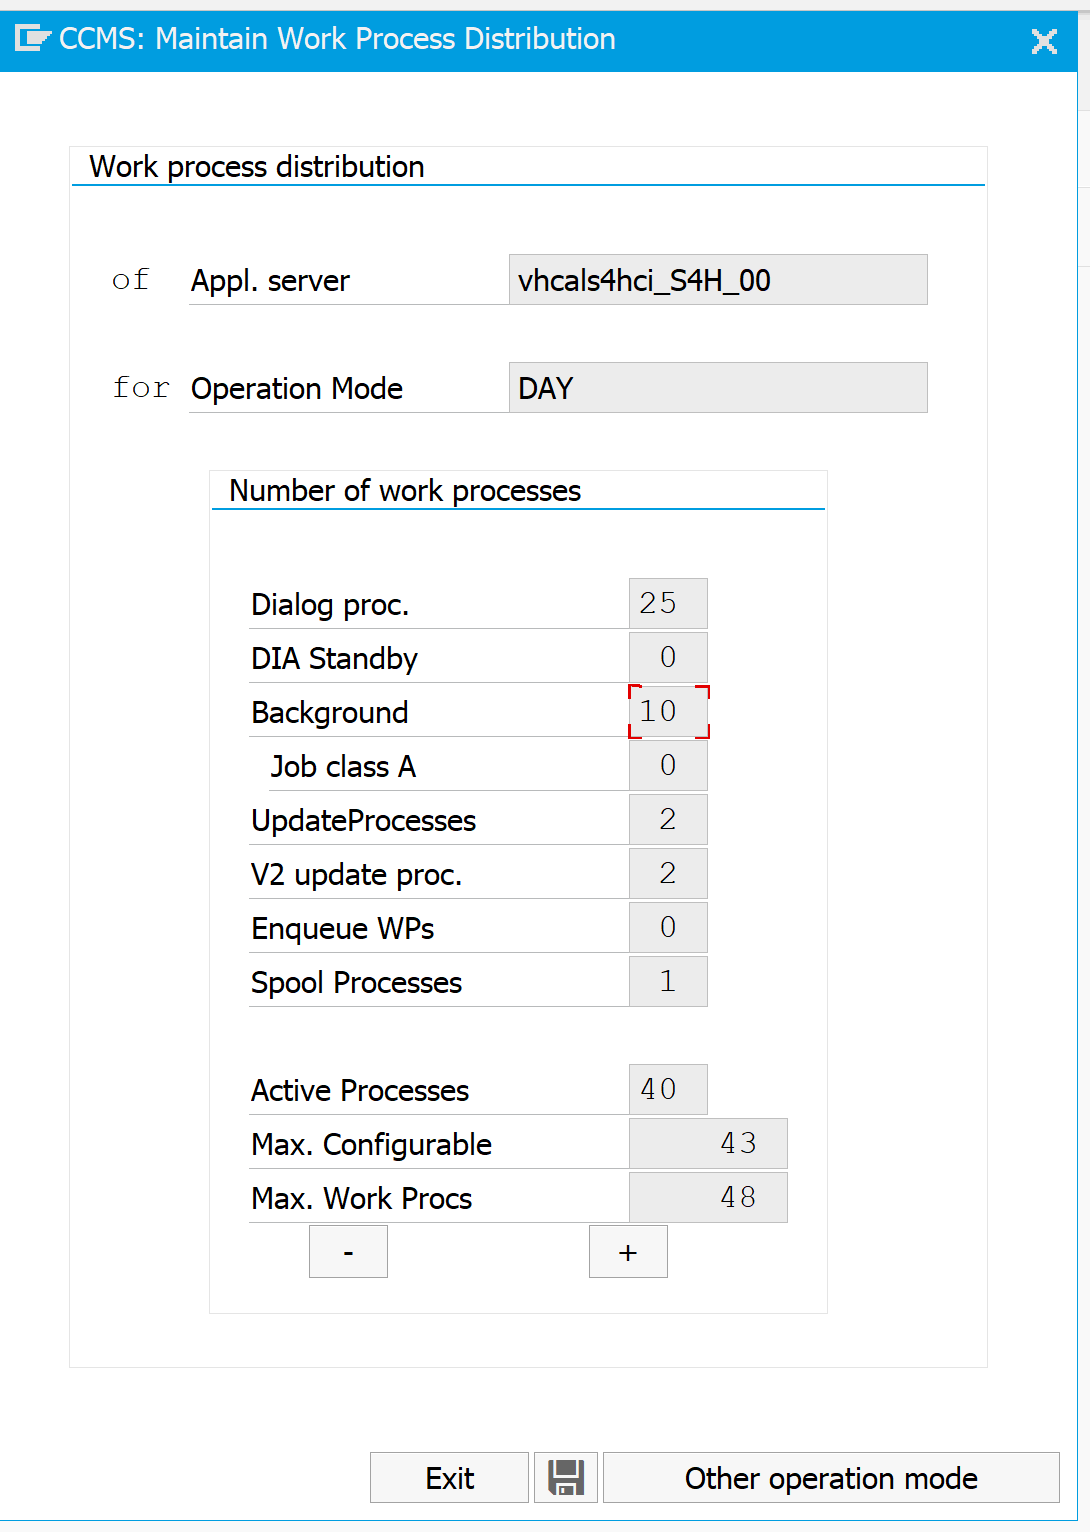
Later on you can always change the work process distribution:
Put the cursor on the type (example Background) and use the plus and minus to increase or decrease the amount.
Make sure both DAY and NIGHT are properly setup now. Check in RZ04 start screen.
Amount of DIA versus non-DIA processes
To avoid issues, make sure the amount of DIA work processes is always greater than the amount of non-DIA work processes. See point 4 of the SAP OSS note 1970757 – Outbound qRFC scheduler with status RES_LACK. This note explain issues you can get in your system if you don’t apply this rule.
Time table assignment
Now that we have the two operation modes DAY and NIGHT, we need to tell the system when to use which one.
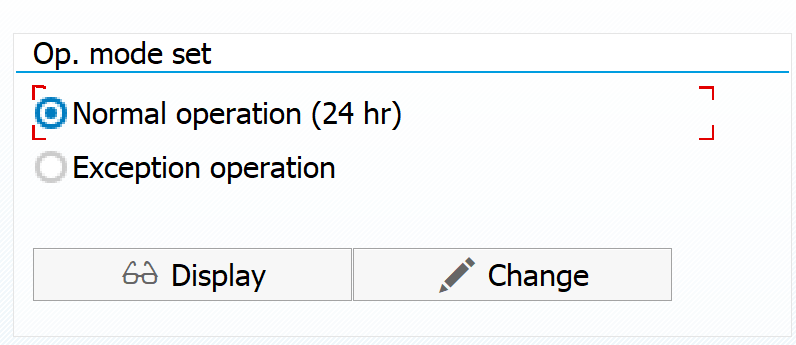
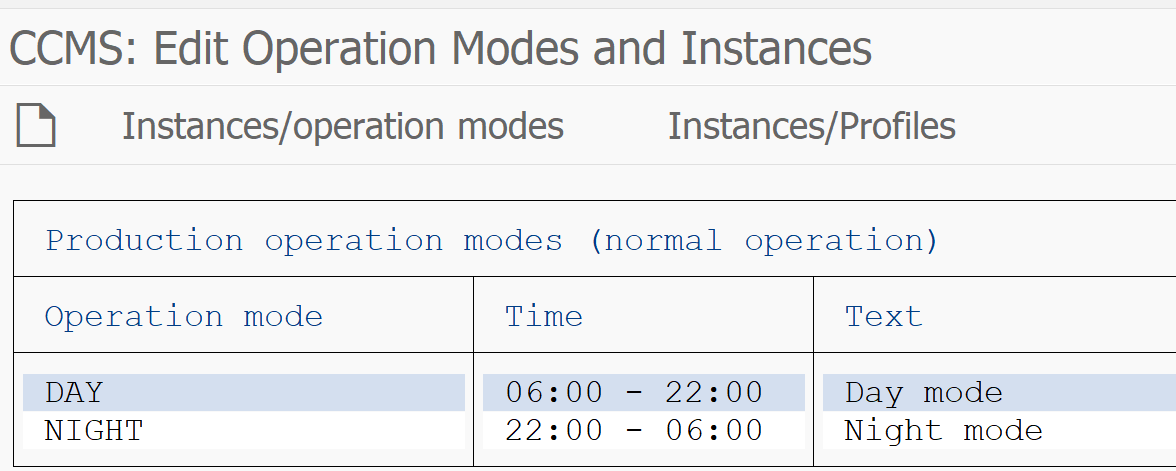
In the RZ04 main screen choose menu Operation Mode and then Timetable (or transaction SM63 directly). You reach the initial time table screen:
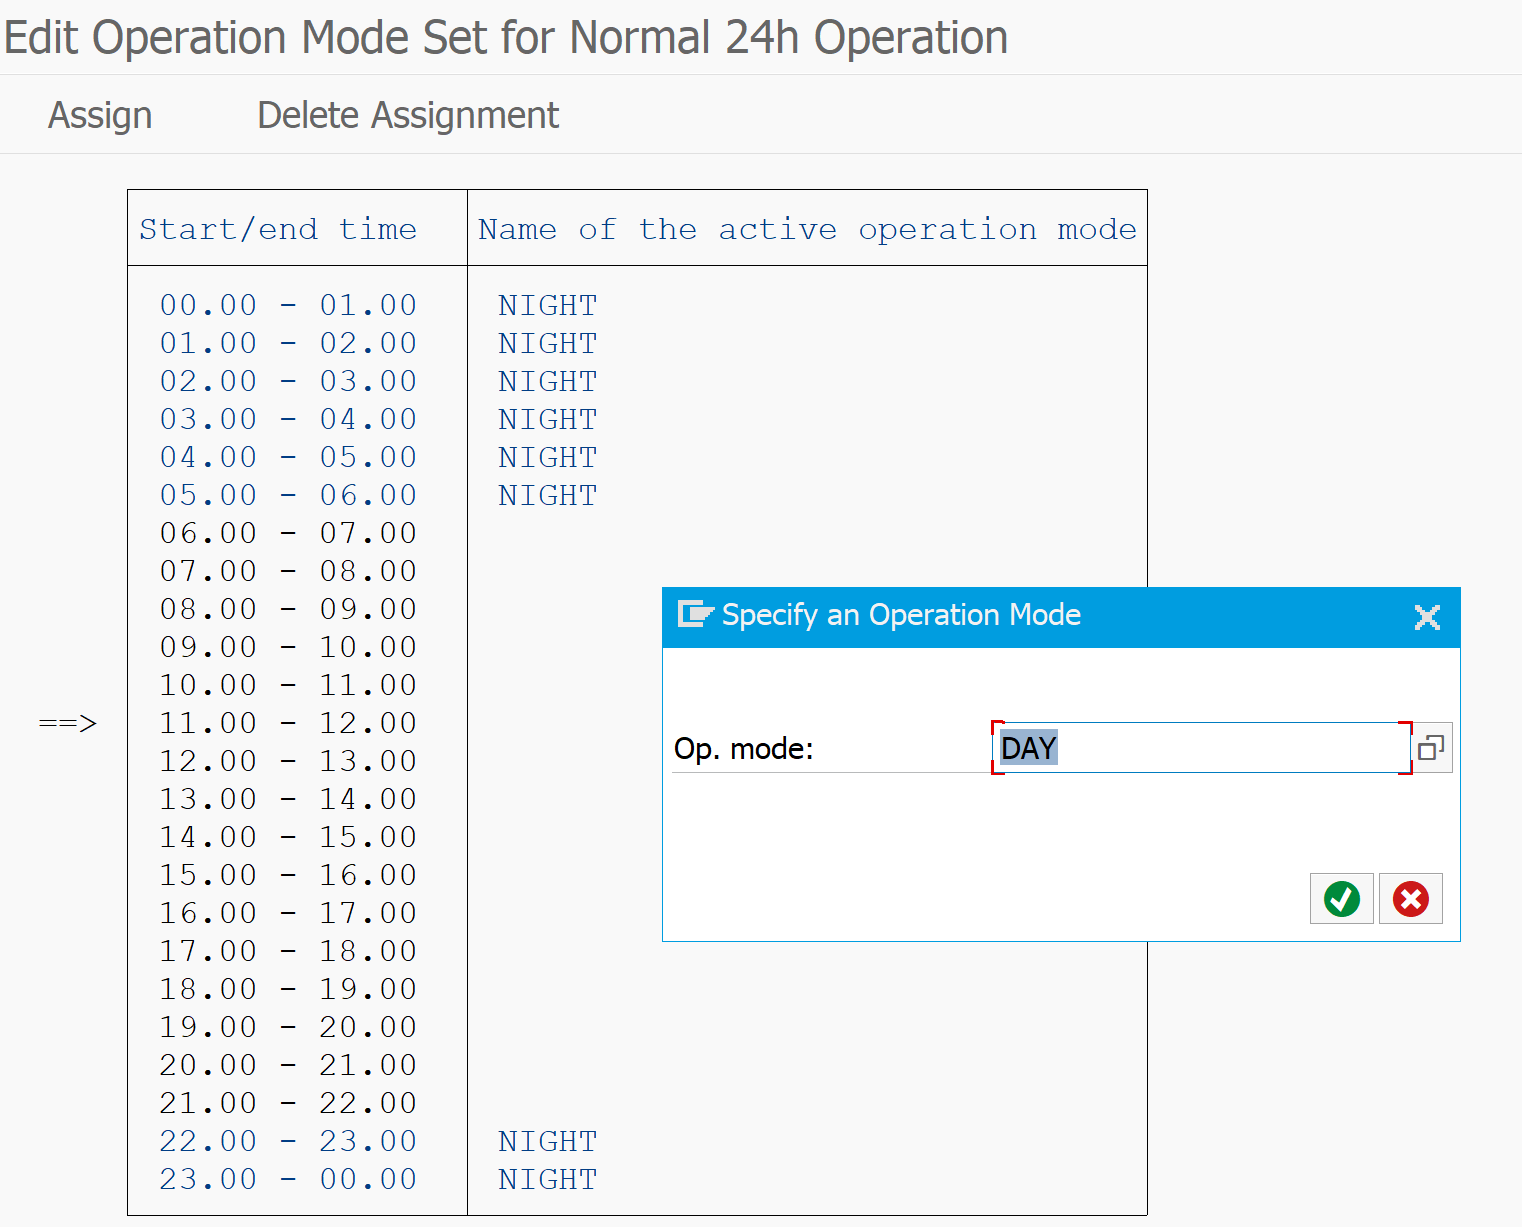
Choose the normal operation. Here you assign the operation mode to the time table:
This UI is bit unfriendly: double click on first time, then on last time, then assign operation mode. When done save the input.
Result in RZ04:
Activation of operation mode
Now this is done, you might check in SM50 to see nothing has changed. This is because the operation mode is defined, but not activated yet to run.
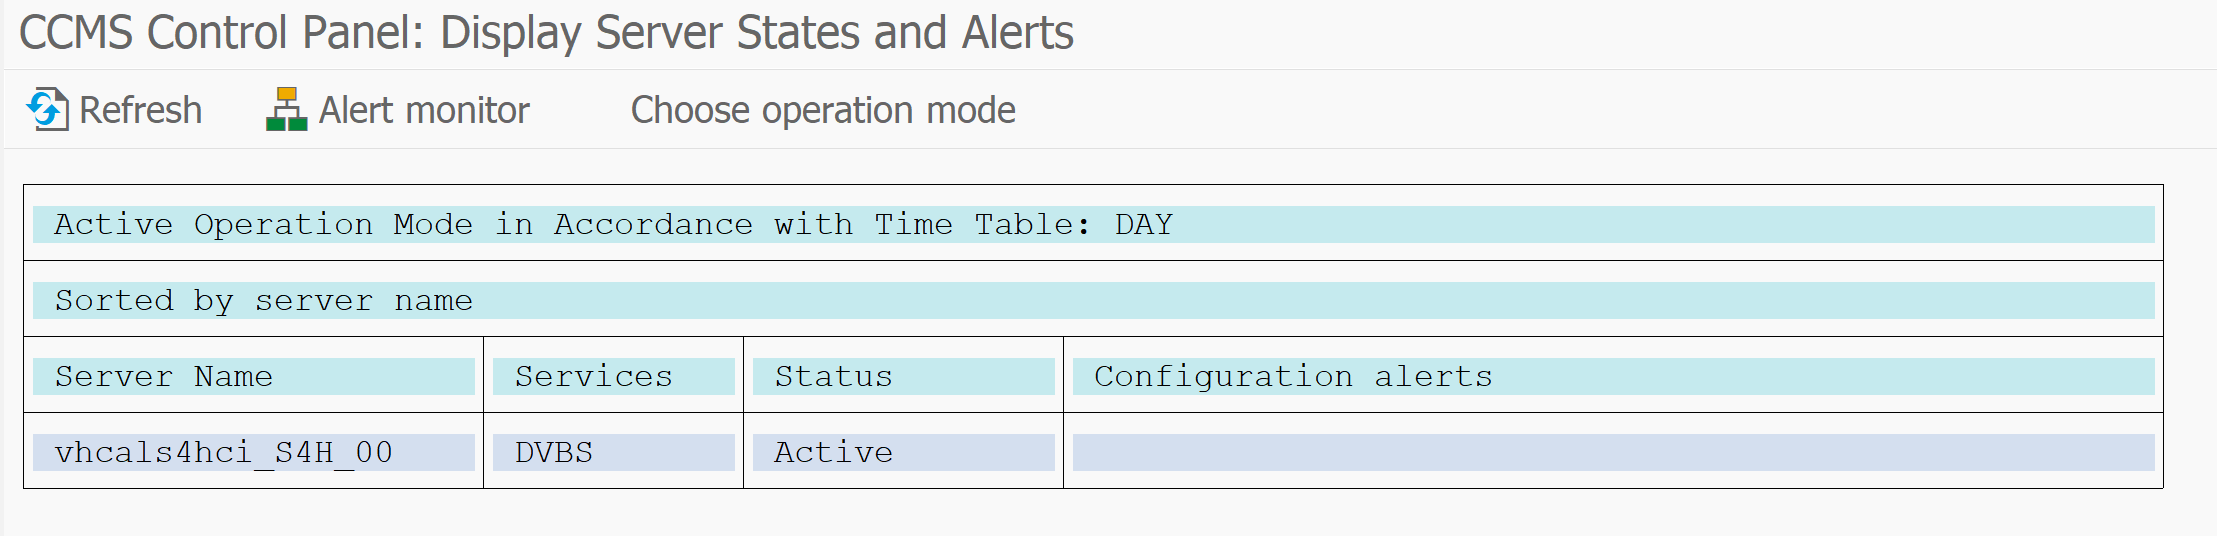
Go to transaction RZ03 and choose the operation mode you want to go to by selecting the Choose operation mode button.
In the menu select Control, Switch Operation Mode, All servers. Confirm the switch.
Now if you check in SM50 you see the switch is almost immediately effective.
Change of operation mode during system issues
During system issues you might want to use the switch in operation mode or change the work process distribution.
Use case 1: project team needs to do conversion on the fly in the system and did not notify basis team. All batch processes are filled up. Temporary quick solution: switch to NIGHT profile.
Use case 2: somehow the update processing is slow and you see bottleneck in UPD processing. Temporary quick solution: change the DAY profile to have 1 or 2 more UPD processes and less of something else. Save DAY profile and goto RZ03 to activate. After issue is resolved, don’t forget to revert back to normal. In this case it might be due to growth that anyhow more UPD processes were needed in the system.
Bug fix OSS notes
Please check following bug fix notes in case of issues:
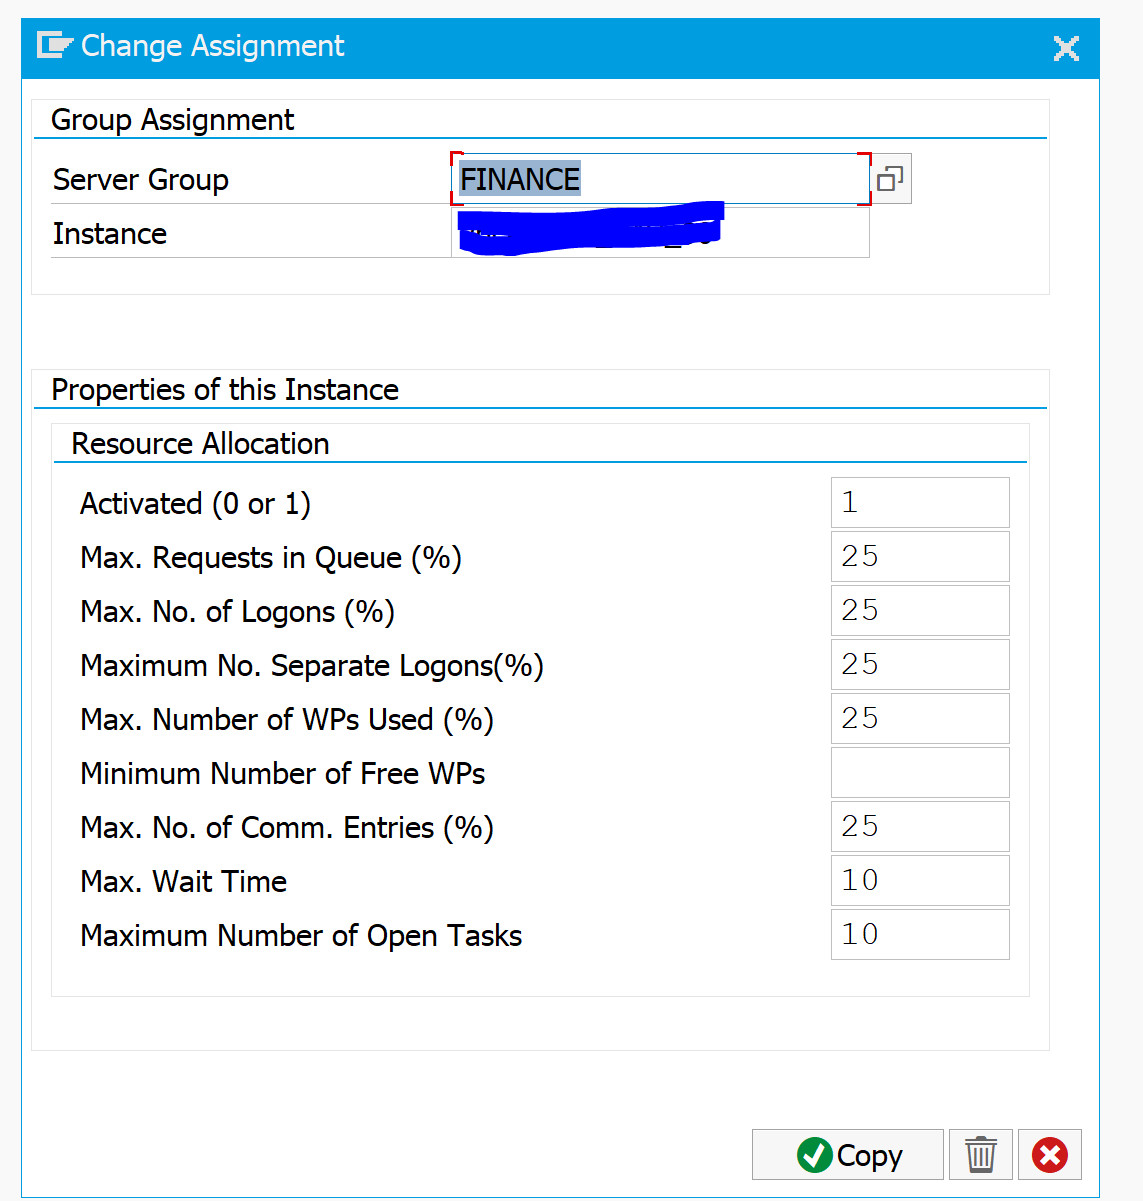
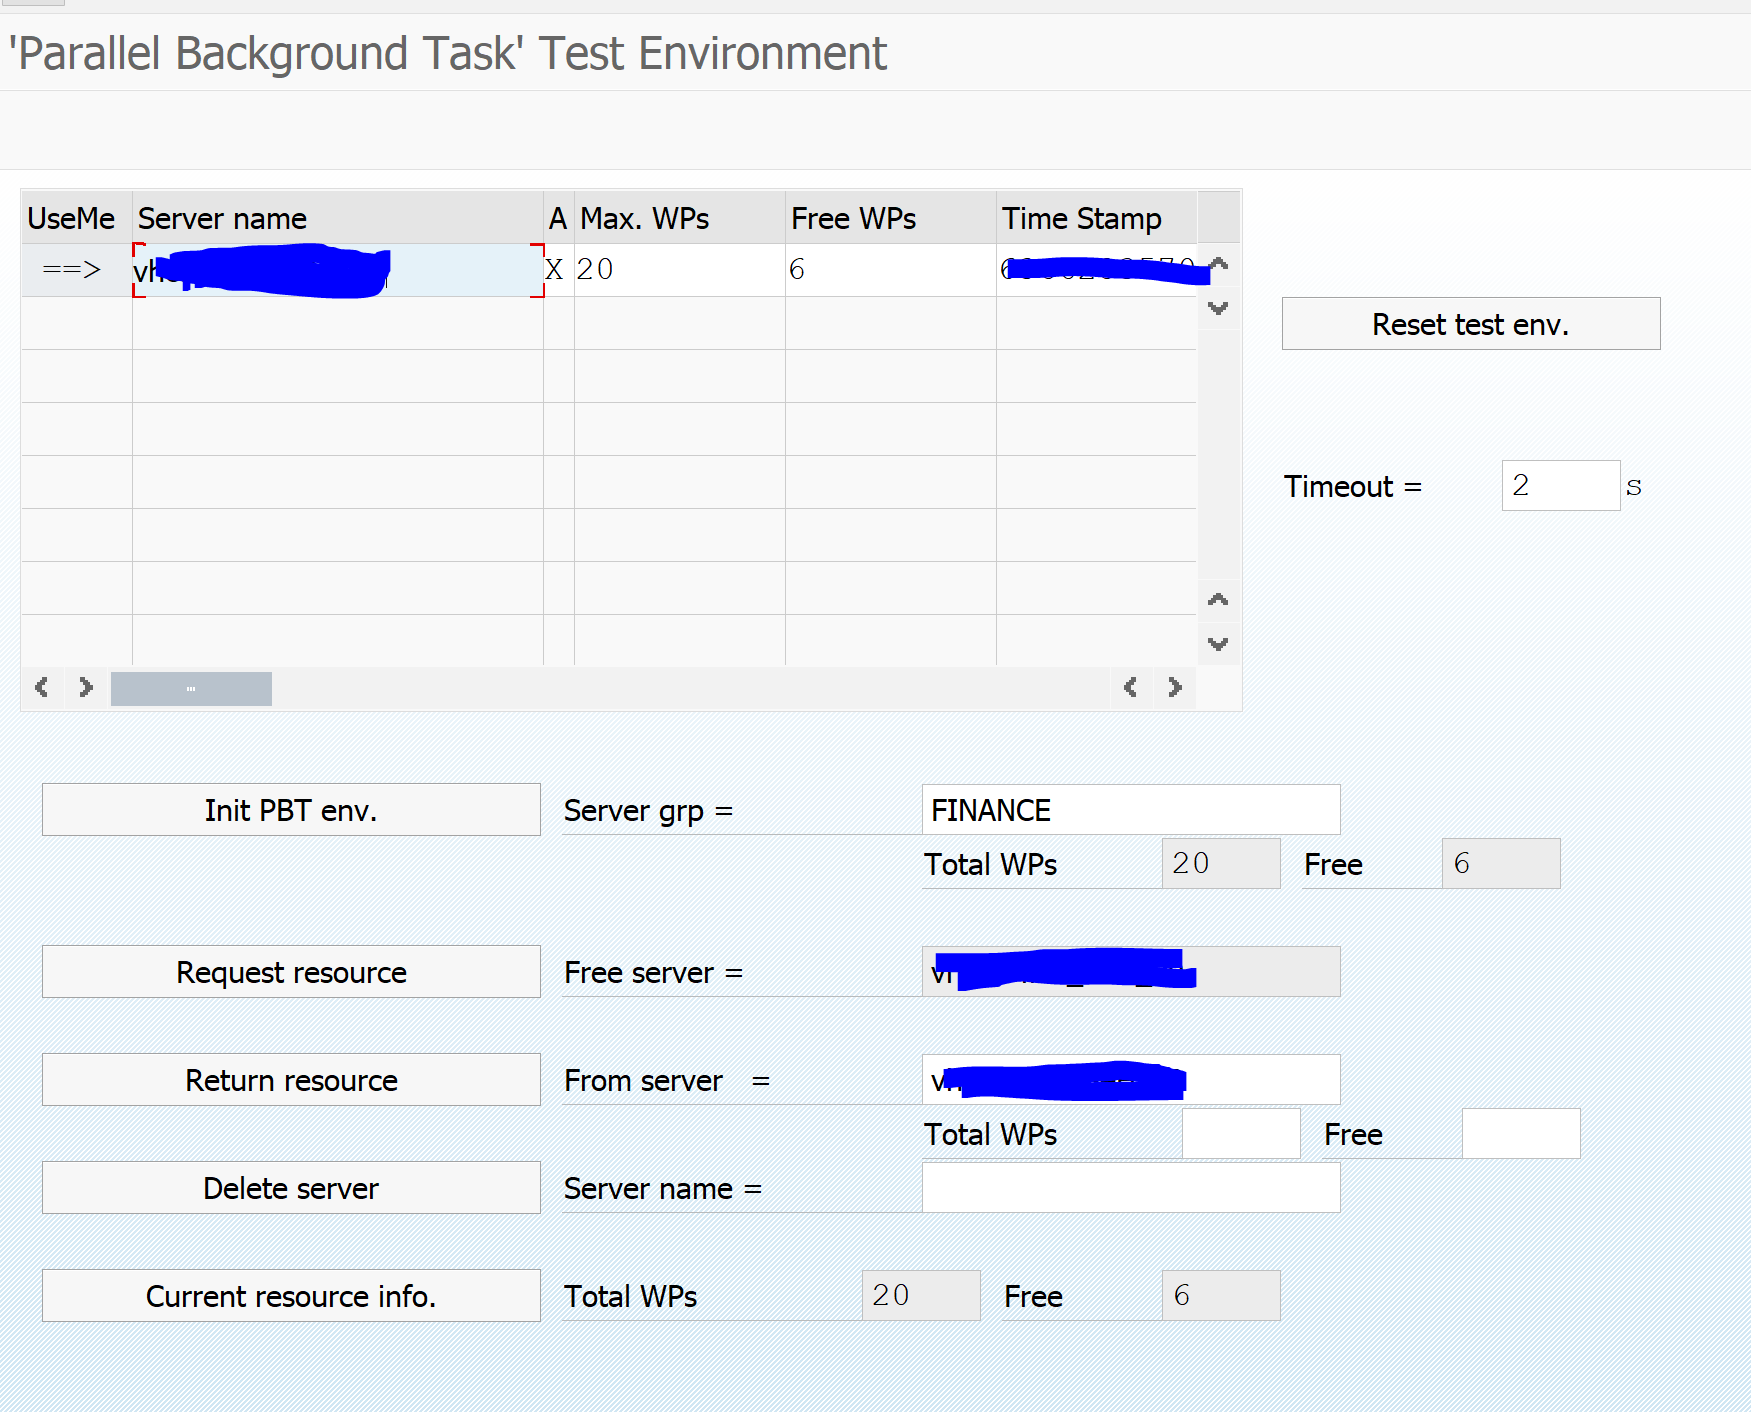
Transaction SBPT brings you to the parallel background test environment:
Here you can evaluate your settings.
Real live use
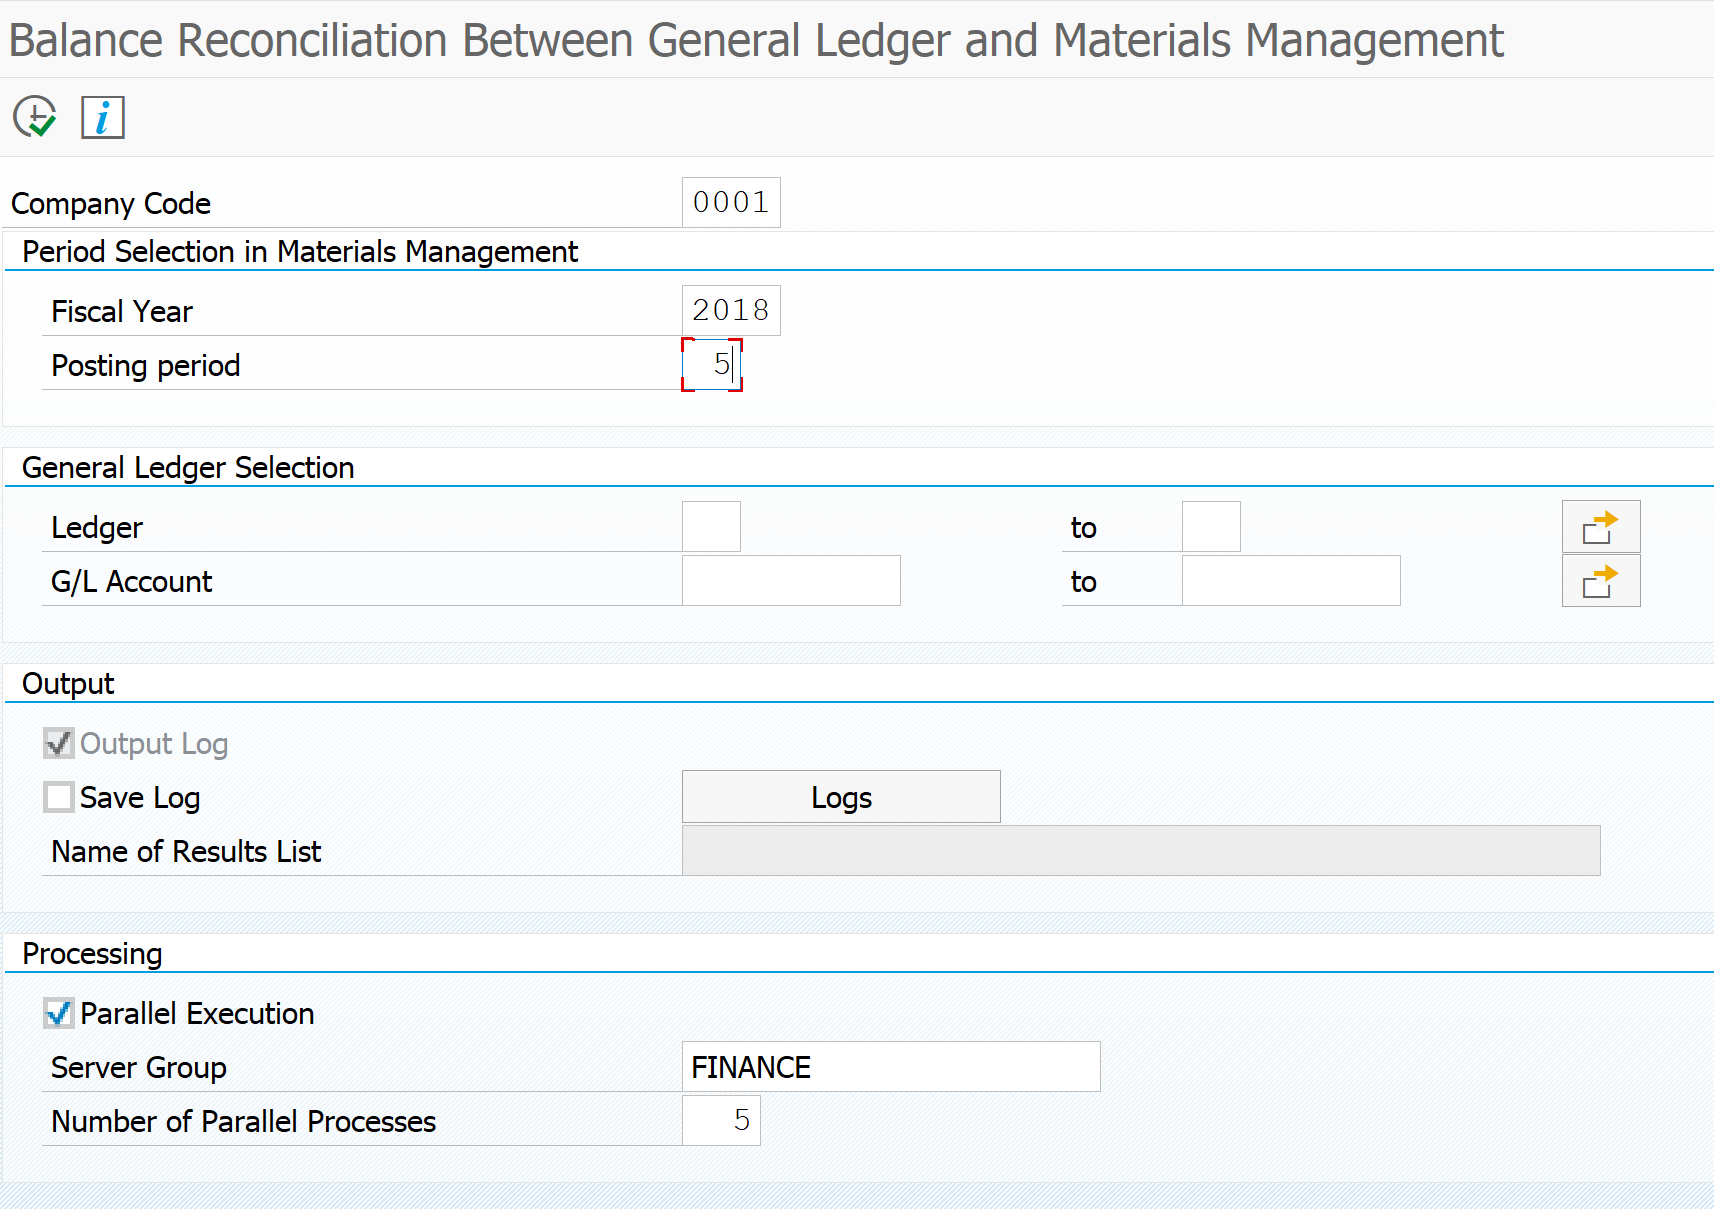
Some SAP transaction use parallel execution. Example is transaction code FAGL_MM_RECON.
More on load balancing
Parallel processing is an important part of load balancing across multiple application servers. More on load balancing can be read in this dedicated blog.