FIORI App Recommendations

SAP has a tool called FIORI app recommendations to give you a view on potential FIORI apps you might be able to use. The source is the ST03 usage data from your system.

Questions that will be answered in this blog are:

  • How to run the FIORI app recommendation tool?
  • How to feed it with the ST03 data?
  • How to view the results of the FIORI app recommendation tool?

Running the analysis

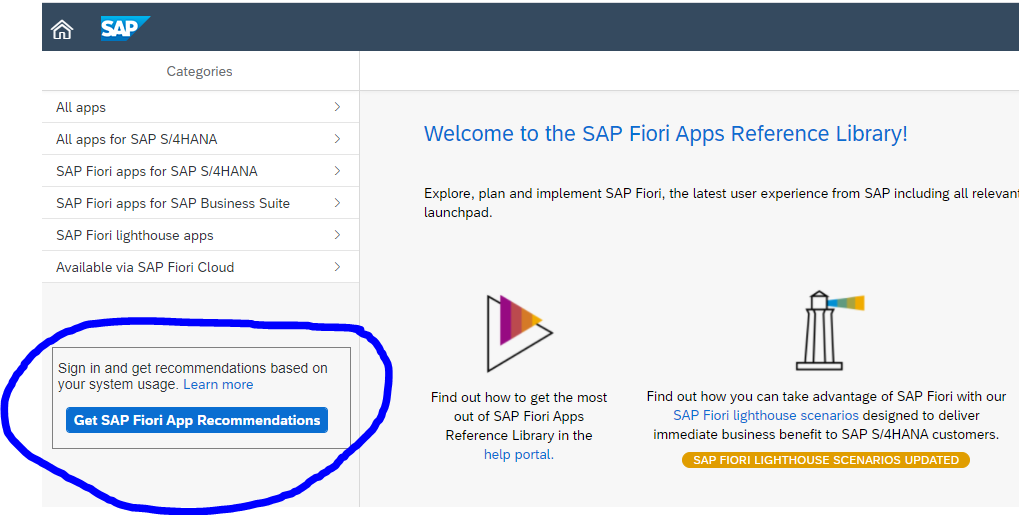
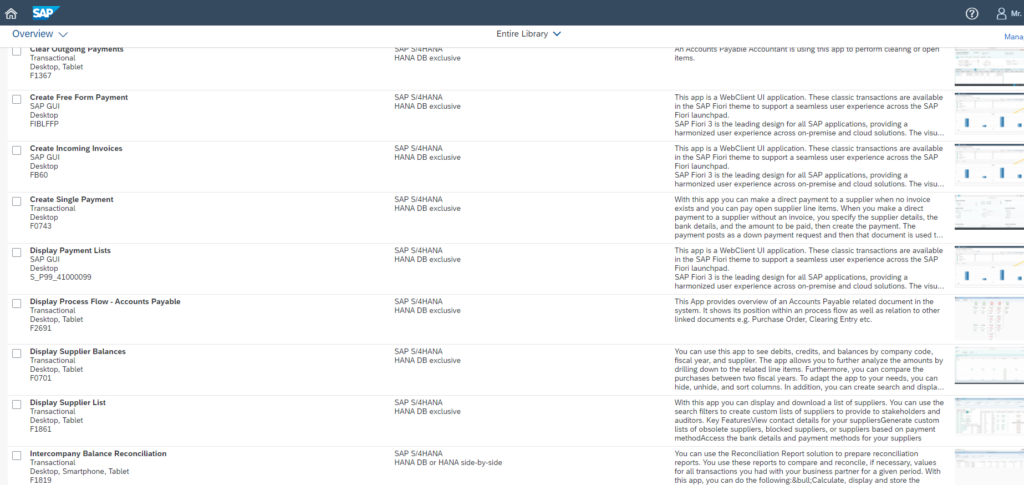
Goto the Fiori Reference Library. There you will find a button to go to the FIORI app recommendations tool:

Create a new analysis:

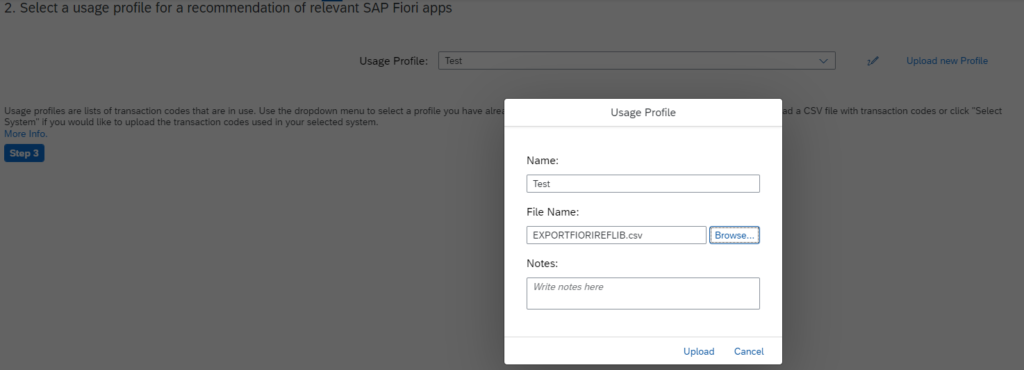
In step 2 you need to upload the ST03 usage profile in CSV format. This is described in this SAP help file. So first create the file (in short, goto ST03, select last month, transaction profile standard, download to xls, remove header and save as CSV), then upload it in this step:

Upload front end and backend profile (in case on S4HANA embedded FIORI these are identical):

Name the analysis in step 4 and press the button to get to the analysis results:

Viewing the results

In step 1 above now select view results:

Background information

More background can be found in OSS note 2696033 – How to Generate SAP Fiori App Recommendations.

System usage: SCMON ABAP call monitor

For several use cases you might need to get a more detailed insight into your SAP system. One of the tools is ST03N (read more about it in this blog), but it focuses on transactions. If you need more details on the calling ABAP coding, the SCMON tool might be a better solution. SCMON is the successor of the UPL tool (Usage and Procedure Logging).

Questions that will be answered in this blog are:

  • How to switch on SCMON tool?
  • How to use the results of the SCMON tool?
  • How can I find back from a piece of code to where it is actually used in a transaction, RFC call, ODATA call, etc?
  • What is the impact of the SCMON tool on system performance?

Activation of SCMON

The minimum requirements of SCMON are described formally in OSS notes 1828848 – Usage & Procedure Logging and ABAP Call Monitor: Technical prerequisite (UPL/SCMON) and 2679723 – ABAP Call Monitor, but basically it is available on any supported modern ABAP stack.

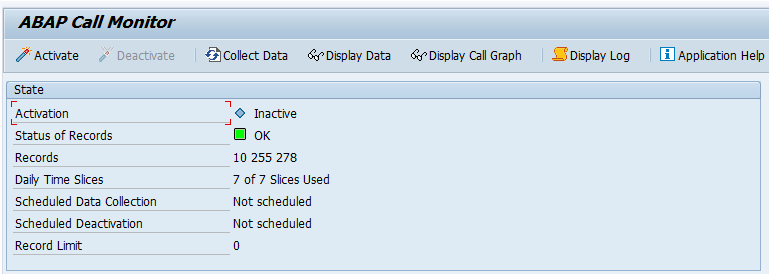
Start transaction SCMON:

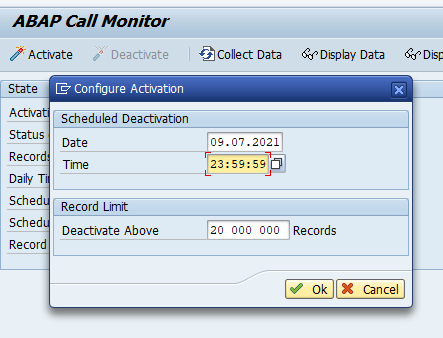
Press the activate button and set the end time settings for the SCMON monitor:

Use of SCMON data

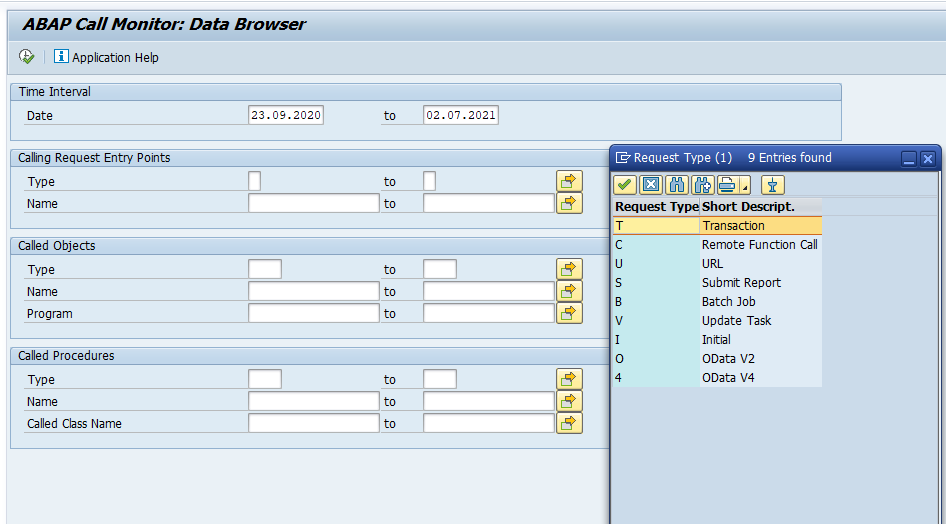
If data is gathered you can already use the results, or you can wait until the data collection time is completed. To display the data start transaction SCMON and hit the Display Data button:

Here you can already see a benefit over ST03N: you can select request type batch jobs, URL, ODATA call, or RFC call next to transaction.

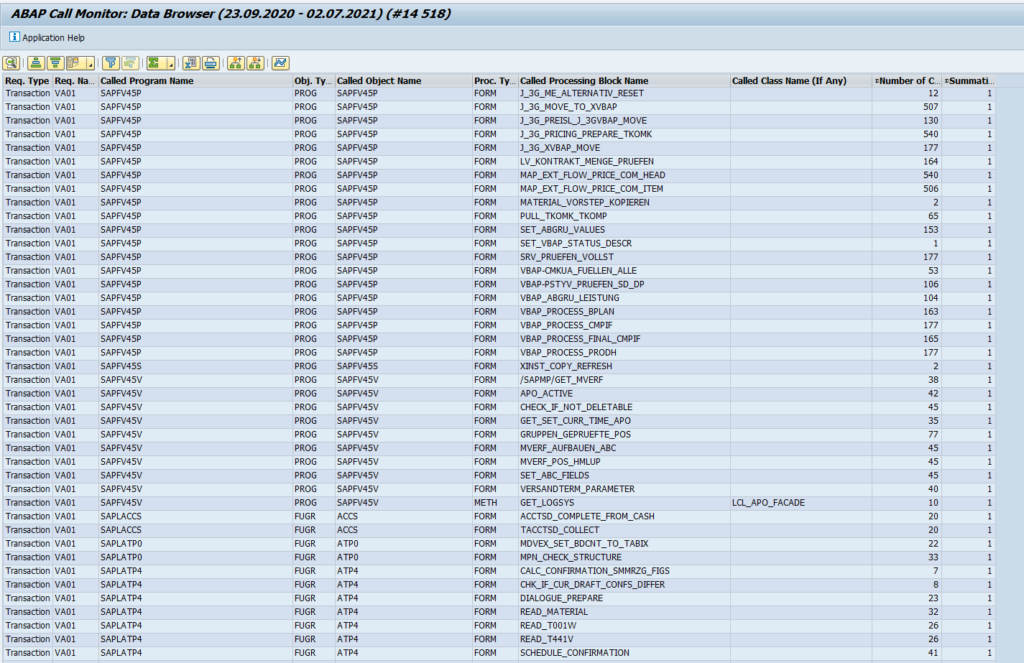
As example we show the result of transaction VA01:

Now you can see in very much detail which ABAP points are called for VA01.

You can also use it the other way around. Suppose we apply an OSS note to class CL_UKM_BUPA_FACTORY and want to determine the impact. If we do a where used list in SE24 on this class we get 134 new calling points and we don’t even know which ones are used.

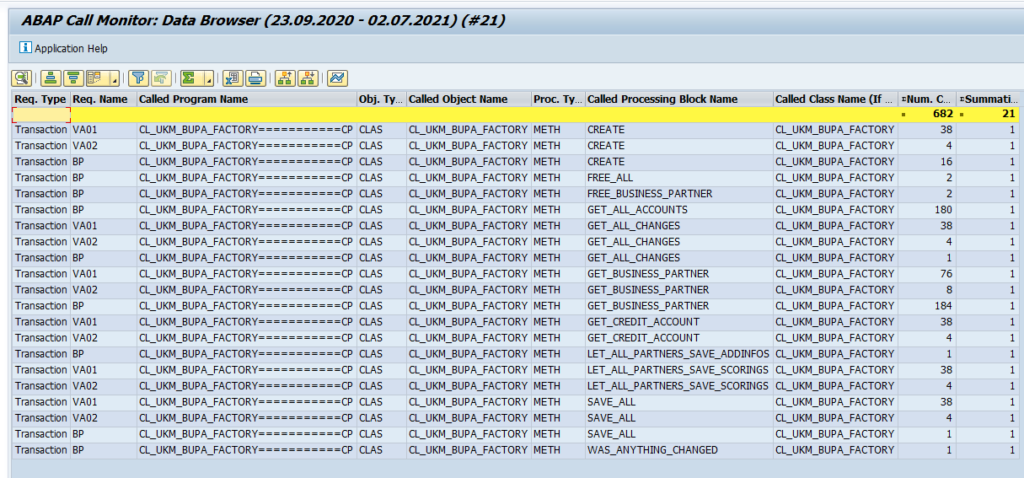
If we input CL_UKM_BUPA_FACTORY in the CLASS field and search for it, we get this result:

Now you can see that in our system the transactions VA01, VA02 and BP are using this class. Those need to be tested.

This is the big advantage of SCMON: it only takes used code and the code is related back to the start point which you can relate to, like a transaction, batch job, ODATA call, etc.

Performance of SCMON

If you worry about SCMON performance on your production system, it is about the same load as the old UPL. There is a parameter to fine tune performance described in OSS note 2657522 – New profile parameter and improvements for ABAP call monitor.

The exact impact of SCMON on performance is clearly described in OSS note 3098211 – Memory and performance requirements of the ABAP Call Monitor.

Condensing data with SUSG

With transaction SUSG the SCMON data can be condensed. Read more about it in this blog.

SAP background

Background of SCMON can be found in this SAP blog.

Bug fix OSS notes

Bug fix OSS notes that might be relevant for you:

System usage: ST03N

For many different purposes you need insights into your system usage. Which transactions are used and how intensive.

This blog will explain the system workload usage tool ST03N.

The other usage tool SCMON ABAP call monitoring is explained in this blog.

Questions that will be answered are:

  • How to get workload overview from the SAP system?
  • How to get time based profiling information from the SAP system?
  • How to get list of transactions used from the SAP system?
  • How can I quickly download ST03N data with program /SDF/ST03DL?
  • What are the limitations of ST03N?
  • How can I set the data retention for ST03N?
  • Can I check for HTTP usage next to ABAP usage?

Use of ST03N

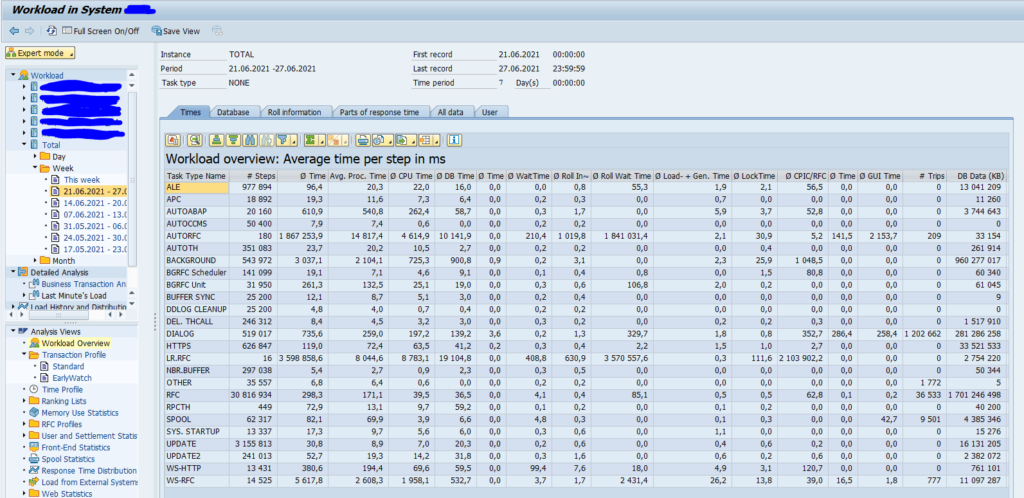
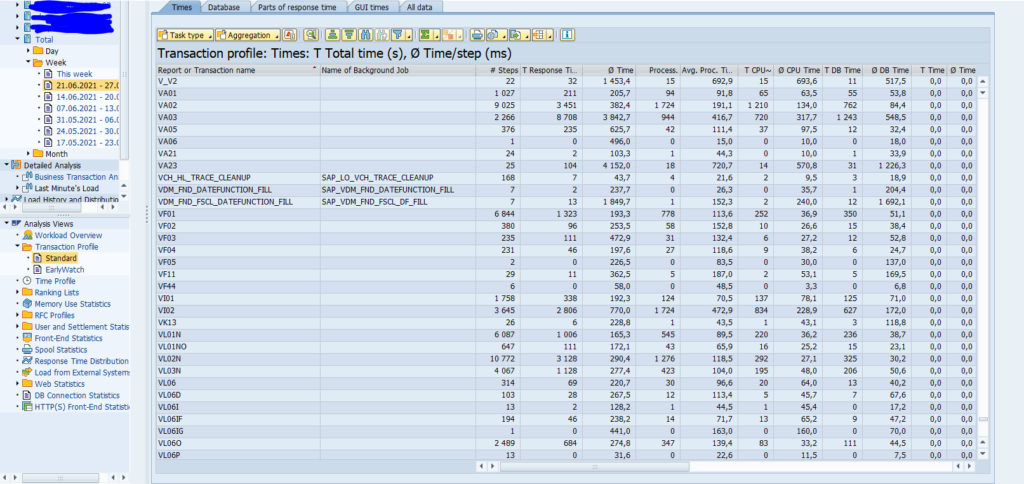
Start transaction ST03N. In the left pane select the application server or total system and time frame to get an overview of the system workload for the several task types:

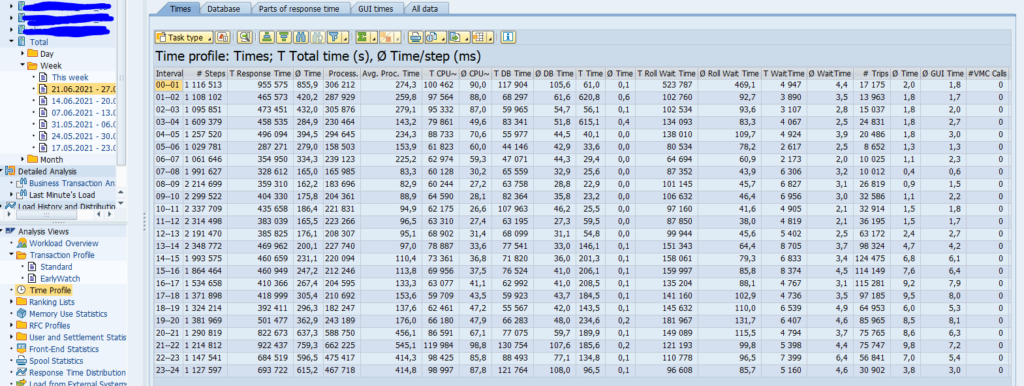
With the time profiling you can see the distribution of workload during the hours of the day:

You might see peak hours based on the spread of your users and batch jobs.

In the default system the 24 hours are not visible. Follow the steps in this blog to enable it.

If in ST03N there is no data visible, set parameter parameter stat/level to 1 (Statistical records are active). See OSS note 2675074 – No workload data in transaction ST03N or ST03.

Transactions from ST03N

To get an overview of the user transactions select in the analysis view the Transaction profile:

You can download this overview to xls for further analysis on the transactions used. For explanation on the columns, read OSS note 2778959 – ST03N – Complexity of data displayed in “Parts of response time” tab.

Please be aware of the following limitations from ST03N when making conclusions for system usage:

  • ST03N has limited time frame, some transactions are rarely used, but still vital (like irregularly used repair transactions, basis actions which are rarely done but needed in case of emergencies, year end closing transactions, etc.). See OSS note 1843151 – ST03 Data Retention Time Settings on how to set the retention periods.
  • ST03N does not collect indirectly called transactions in custom code. This means if custom code uses a call transaction XYZA, the transaction XYZA is NOT recorded in ST03N

If more detailed information is required, check the SCMON ABAP call monitoring tool, which is explained in this blog.

Alternative way of downloading ST03N data

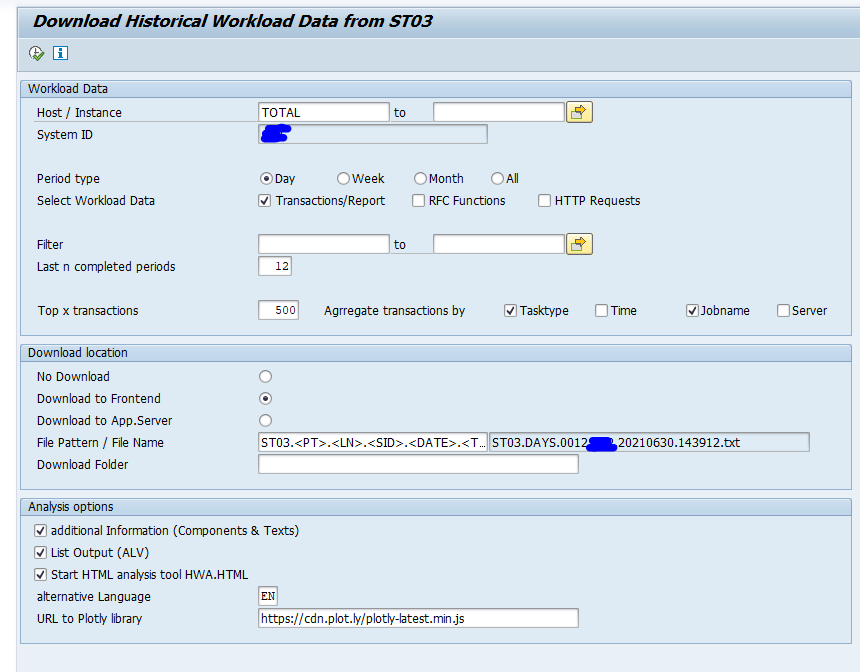
As an alternative you can use program /SDF/ST03DL to download ST03N data:

More information about this download program can be found in OSS note 2943445 – Download Historical Workload Data from ST03.

Also check these OSS notes:

Copying ST03N data to different system

Apply OSS note 2568736 – SAP Readiness Check for SAP S/4HANA – copy ST03N data and follow the instructions to download and upload the ST03N data. This program was primarily developed for the SAP S4HANA readiness check.

Usage of ST03N to determine HTTP calls

You can use ST03N to determine HTTP(s) calls in your system. Read more in this blog.

Usage of ST03N to determine RFC calls

You can use ST03N to determine RFC calls in your system. Read more in this blog.

LR.RFC tasks leading to distorted statistics in ST03

Some LR.RFC tasks may be very high and leading to distorted statistics or wrong interpretation on ST03. You can ignore these high LR.RFC tasks. This is explained in OSS note 3101968 – High response times of LR.RFC tasks in ST03/ST03n.

ST03N data retention

Data retention for ST03N is set in Collector and Performance DB -> Performance Database -> Workload Collector Database -> Reorganization -> Control.

For a full background, see OSS notes 1843151 – ST03 Data Retention Time Settings and 3285517 – Reorganizing and Maintenance of ST03 kernel statistical data.

ST03N in SAP Focused Run

SAP Focused Run has a tool called statistical records. This is collecting data similar to ST03N. Read more in this dedicated blog.

ST03N bug fix OSS notes

Bug fix OSS notes for ST03N:

SAP road map explorer

What are new features SAP will deliver in the future for my technology or business product?

This is where the SAP road map explorer helps.

Questions that will be answered in this blog are:

  • How to use the SAP road map explorer?

SAP road map explorer

You can start the SAP road map explorer with the URL https://roadmaps.sap.com/:

Clik on the most viewed road maps, for example SAP S4HANA:

On top you can select a different product like HANA Cloud, ABAP, business technology platform, etc.

Next to the product you can use filters for your process, industry and specific topics to narrow down the list.

By clicking on the innovation you get more details. There is a tab called capability view. This is a very interesting feature, since is shows related innovations for this feature and that will save you a lot of searching time:

FIORI app for monitoring data archiving jobs

SAP has delivered diverse apps for basis administrators.

This blog will explain about the data archiving batch job monitoring FIORI app.

For generic data archiving technical setup: read this blog.

Activating the app for monitoring data archiving jobs

The full activation manual is published on the FIORI reference library.

Short manual:

  • Activate SICF service bas_ilm_jobmon
  • Activate ODATA service ILM_JOB_MONITOR_SERVICE
  • Manually add the tile in your catalog (use edit home page and than add the app)

Using the app display data archiving jobs

The main FIORI app tile will already show the amount of failed jobs:

When you open the app the overview screen comes:

On the left hand side you can choose the archiving object. On the right hand side you can see the last archiving jobs for the selected object.

When you click on a job, you can see the details per job:

There are tabs for the job results, job log details and application log.

Bug fix notes

Bug fix OSS notes:

FIORI app for display mail transmissions

SAP has delivered diverse apps for basis administrators.

This blog will explain about the display email transmissions FIORI app.

Activating the app display email transmissions

The full activation manual is published on the FIORI reference library.

Short manual:

  • Activate SICF service nw_aps_om_eq
  • Activate ODATA service APS_OM_EMAIL_QUEUE_SRV
  • Manually add the tile in your catalog (use edit home page and than add the app)

Using the app display email transmissions

The main FIORI app tile will already show the amount of email transmission errors today:

By clicking the tile you reach the overview screen

By clicking the line you get details plus hints on the possible issue:

Custom program for checking webservice availability

In SOAMANAGER you can test if a web service can be reached by pressing the test connection button. Unfortunately there is no standard SAP program that performs this test in the background. So how to monitor the availability of a web service?

Solution: custom Z program that can be run online or in background.

In this case we have chosen to put the alert into SM21 system log. But you can also replace this part of the code with sending an email.

Preparation

In SE92 (see this blog) create a new message for the system log.

Z program for monitoring web service

Now create a new Z program:

REPORT z_bc_ws_check.

CONSTANTS zmesid TYPE char3 VALUE 'ZZ1'. "system log message ID defined in SE92
DATA: zif_soap_ping TYPE REF TO cl_soap_ws_ping.
DATA: zlv_ok TYPE boolean.

PARAMETERS zservice TYPE seoclsname. "webservice name
PARAMETERS zlp TYPE prx_logical_port_name. "logical port name


START-OF-SELECTION.

  AUTHORITY-CHECK OBJECT 'S_SRT_CF_C' "check soap runtime auhtorizations.
      ID 'ACTVT' FIELD '03'.

  IF sy-subrc EQ 0.

* create object for soap ping test
    CREATE OBJECT zif_soap_ping TYPE cl_soap_ws_ping.

* initialize ok code
    zlv_ok = 'X'.

* try the ping test
    TRY.
        CALL METHOD zif_soap_ping->if_soap_ws_ping~ping_ws
          EXPORTING
            service = zservice
            lp_name = zlp.
      CATCH cx_soap_ping.
* any error, clear the ok flag
        zlv_ok = ' '. "not ok
    ENDTRY.

    IF zlv_ok EQ ' '. "not ok
* write to SM21 system log
      WRITE: / TEXT-004. "ping not ok
      CALL FUNCTION 'RSLG_WRITE_SYSLOG_ENTRY'
        EXPORTING
          sl_message_area  = zmesid(2)
          sl_message_subid = zmesid+2
          data_word1       = zservice ##NO_TEXT.

      IF sy-subrc EQ 0.
        WRITE: / TEXT-001. "succes to write to SM21
      ELSE.
        WRITE: / TEXT-002. "fail to write to SM21
      ENDIF.
    ELSE.
      WRITE: / TEXT-003. "ping ok
    ENDIF.
  ELSE.
    WRITE: / TEXT-005. "not authorized
  ENDIF.

Create the text elements accordingly.

You can change the authorization check and in stead of writing system log message in SM21 do some other alerting like sending a mail, or pick up the entry in SAP Focused Run monitoring.

Running the program

Run the program:

Enter the webservice name and logical port. Hit execute.

You can also run the program in background mode. For example every 15 minutes. Create multiple steps for multiple web services to test.

Explanation

The program simply creates the object of type CL_SOAP_WS_PING to perform the web service ping. The ping test is then performed. Based on the result the text ok or an entry to SM21 is written.

ST07 Application monitor

The ST07 application monitor tool can help you in analysis of your system for performance and usability. It gives an overview of how many users are using which functional part of your SAP system.

Questions that will be answered in this blog are:

  • How to run the ST07 application monitor?

Application monitor

If you start ST07 you reach the application monitor start screen:

Here you can see how many users are defined and actually logging on across the modules. Basis is very high usually since this includes SMEN which is the start menu. The Other category is for Z transaction codes and/or addon software.

By double clicking on any line you can inspect the lower application levels.

DB access analysis

From the main screen, you can hit the button DB accesses to view which application parts are responsible for the majority of the database accesses:

Reporting performance issues to SAP

Questions that will be answered in this blog are:

  • Which information should I provide when reporting a performance issue to SAP?
  • What should I have already checked before submitting performance issue to SAP?

When to report a performance issue to SAP?

You can report a performance issue to SAP when you are sure it is caused by standard SAP.

There are 2 cases:

  1. Overall system performance
  2. Specific transaction performance

Validations to be done upfront:

What information to provide in a performance issue to SAP?

In case of specific performance issues, add as much specific information as possible. Try to have a case in a development, test or acceptance system as well. In these systems SAP can replay the performance issue without running the risk of hampering the end users performance. Add trace files (ANST, ST12) to speed up the analysis for SAP. It also makes debugging and running large trace files easier for SAP.

SAP checklists

Good checklists are present in OSS notes:

ST12 performance tracing

The ST12 performance tracing tool allows you to collect performance data for solving a performance issue for a single transaction.

Questions that will be answered in this blog are:

  • Which data is collected in a ST12 performance trace?
  • How do I execute a ST12 performance trace?
  • How do I analyse a ST12 performance trace?
  • How can I export a ST12 performance trace?

Performance trace collection

Start transaction ST12:

Select the user ID that you want to trace (can be your own user) and leave the ST12 session open. In a second session execute your actions. When you are done, return to the ST12 session and press the End traces & collect button:

Confirm the traces to collect.

Evaluation of traces

On the Collected trace analysis screen section hit the Full screen button:

This will open the easier to use full screen mode for analysis:

Now you can expand the traces and use the ABAP trace, performance trace, SQL trace buttons to launch the required performance analysis tools.

For more background on the tools read the blogs about:

Downloading the trace file

You can download the generated trace file to export to different system or to send to SAP. For example you have recorded the trace in production and want to do the further analysis on the development system.

To export goto transaction ST13 and use tool ANALYSISBROWSER:

Then select menu option Download / Text Download / Export to frontend to download the trace to your desktop or laptop.

Background

OSS background notes on ST12 performance tracing: