Health monitoring can be used to monitor special use cases:
- SLL certificate monitoring
- Windows service monitoring
- OS process monitoring
- OS scripts
- Logfile monitoring
- URL availability monitoring
Health monitoring
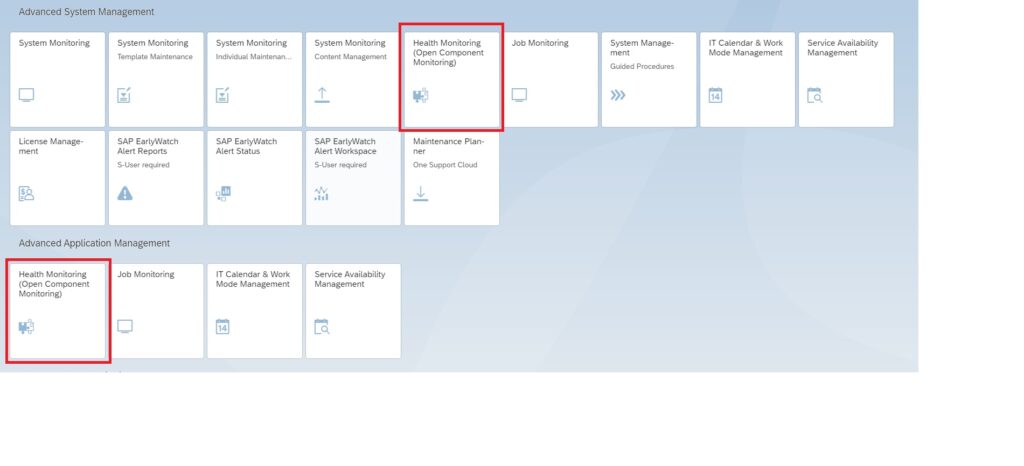
Health monitoring can be started with the Fiori tile:
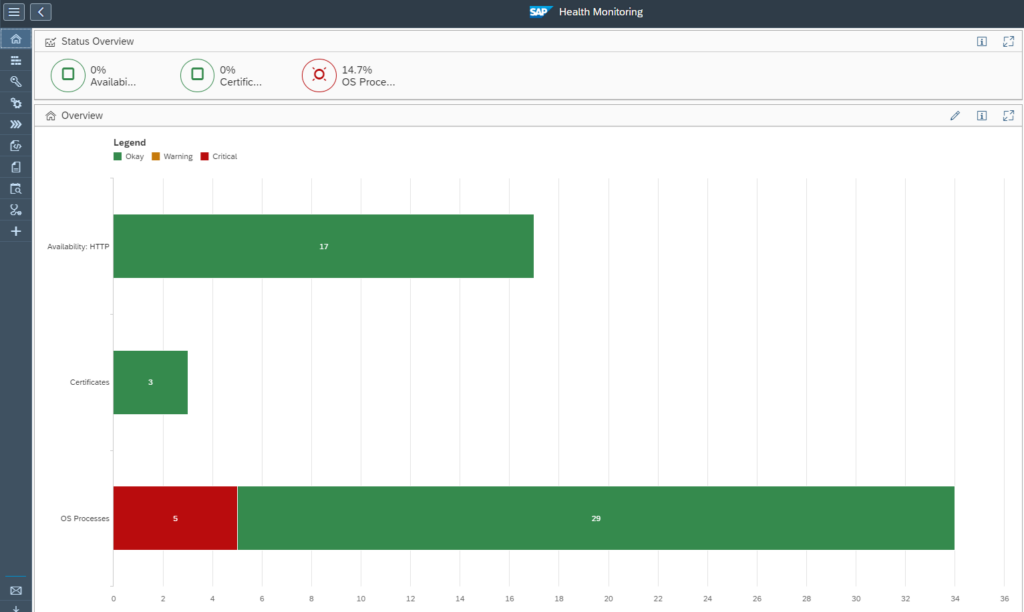
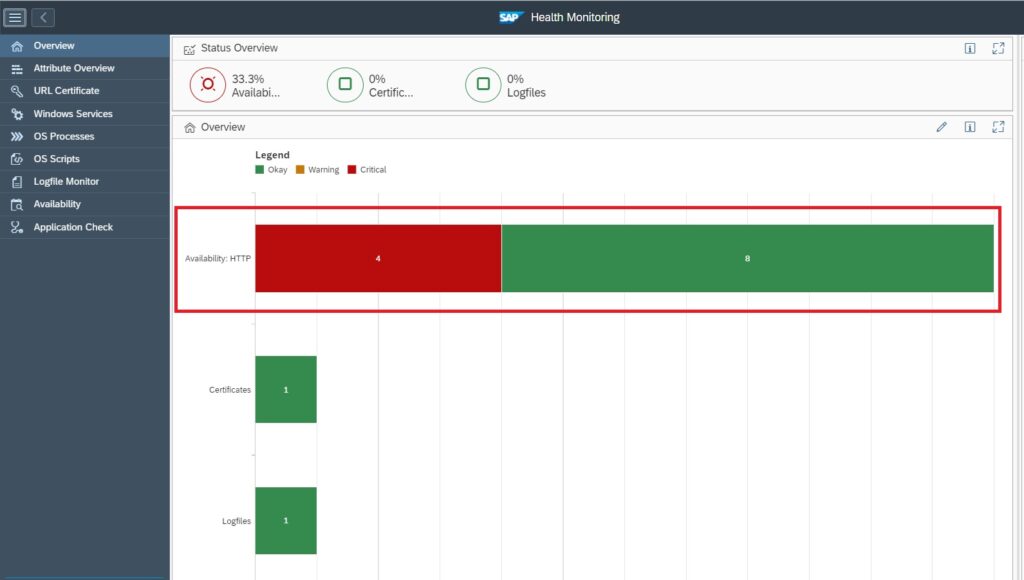
The overview screen opens:
From the overview you can immediately zoom to the error by clicking on the red bar:
Health monitoring content update
For updating content of health monitoring, follow the instructions in OSS note 3360399 – Unable to import the FRUN-CONT package FRUNCONT40003_0-80008241.ZIP.
URL availability monitoring
Health Monitoring provides a functionality called Availability Monitoring wherein we can monitor:
- HTTP Availability: Monitoring availability of URLs.
- TCP Availability: Monitoring the availability of a TCP port or the availability of a host.
- RFC Availability: Monitoring availability of RFCs specifically for measuring availability of an application server instance of an SAP system or the availability of a message server port of an SAP system.
In this blog we will explain how you can configure a HTTP Availability monitor to monitor availability of a URL.
Setup of URL availability monitoring
Step1: Assign Agent for data collection
The HTTP availability is measured by making a URL http or https call by a designated Simple Diagnostic Agent from your specific customer network in the Focused Run system.
The first step is to assign a Simple Diagnostic agent as the collector for this metric.
For this open the Health Monitoring App from the Focused Run launchpad.
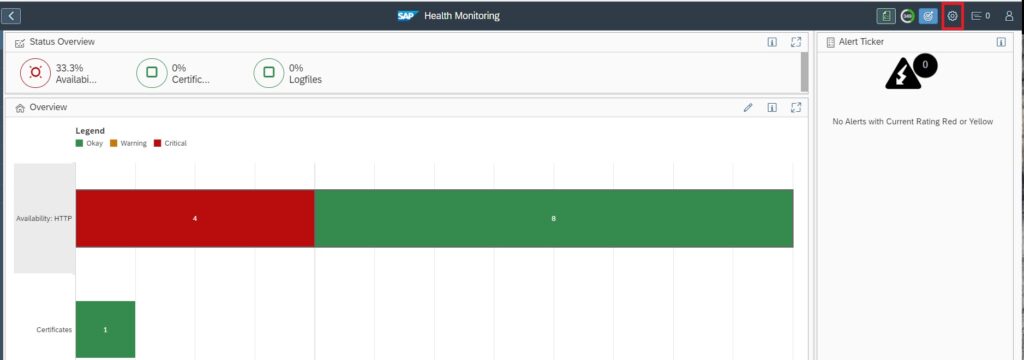
Navigate to Configuration area by clicking on the Configuration button.
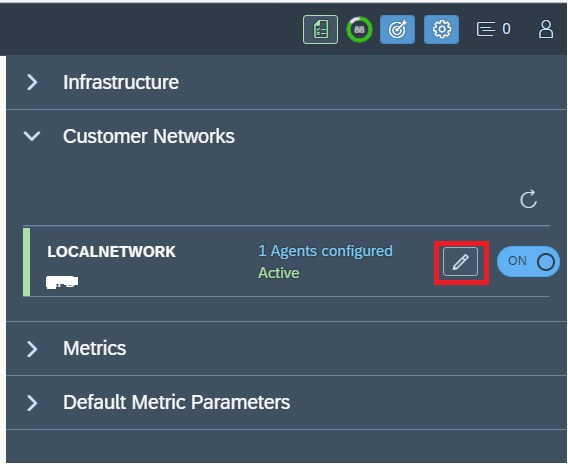
Expand the Customer Networks node and click on the change button.
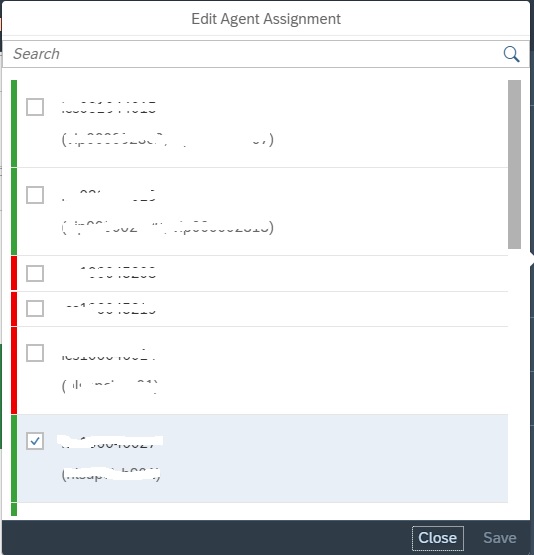
In the next popup select the agent from the list of all connected agents to this customer network.
Step2: Configure HTTP Availability Metric
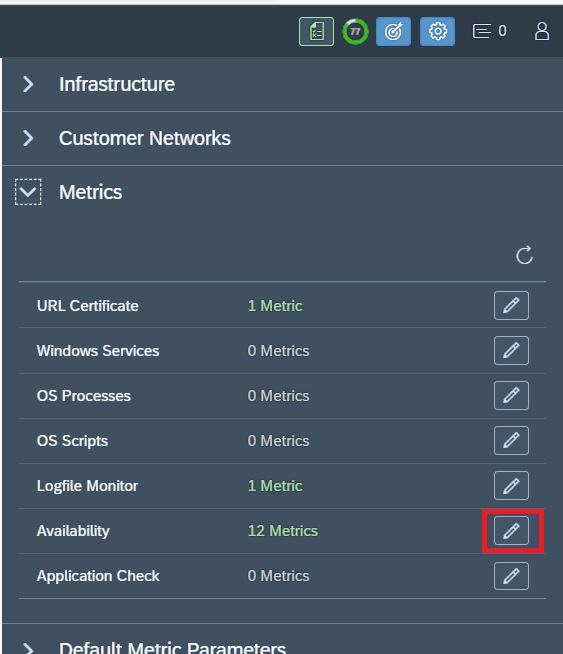
In the Configuration area expand the metric node and click on the change button for Availability under Metrics node.
In the next pop-up screen click on the Plus button to add a metric.
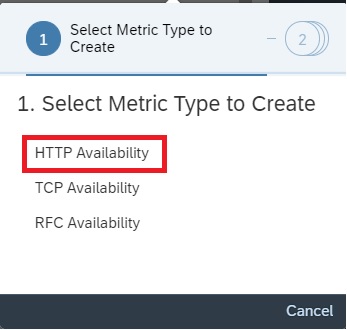
In the next pop-up screen select HTTP Availability
Enter the following details for a basic URL Availability check.
| Field | Description |
| Metric Name | A descriptive name for the metric |
| Customer Network | Select the customer network for which you want to create the metric |
| Collection Frequency | Specify the collection frequency, how frequently the check should be performed. |
| URL | Enter the URL to be monitored |
| Proxy | Enter the proxy detail if the URL is reached via a proxy from the customer network. Else select None. |
| Authentication | Enter the authentication type None or Basic or oAuth and enter the details based on authentication type. |
| Timeout | Period in milliseconds (ms) before a call fails. |
| Number of Retries | Number of times the data collector calls a URL until it receives a response. |
You can also further customize based on type of call you want to do to the URL for instance sending a POST request. For details you can refer to the SAP documentation here.

Optionally you can also enable alerting and notification in the Alert section of the configuration.
After entering all the details save your configuration to activate the metric.
URL availability monitoring usage
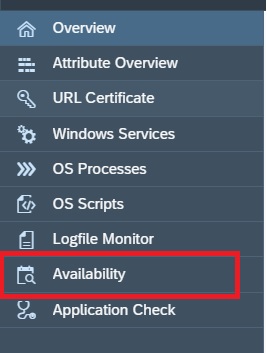
To navigate to the URL availability monitors you can click on the Availability button in the navigation panel.
Or you can also navigate from home screen.
Upon navigating to the Availability monitor metric list you will see the status of all URL availability metrics configured. The metric list view shows us the number of days and hours since the URL is available or unavailable. It also shows us the response time when accessing the URL.
This way you can not only monitor the URL availability but also the performance of an URL with regards to the response time while accessing the URL.
OS process monitoring
With OS Process Monitoring functionality we can monitor the availability of critical OS level processes on any host.
With System Monitoring templates you can also activate custom metric for monitoring OS processes however this will be applicable for all system/hosts for which you activate the template.
For monitoring critical OS processes for specific hosts you need to setup using Health Monitoring functionality.
To access Health Monitoring functionality you can navigate to Health Monitoring app in the Focused Run launch pad.
Prerequisite for OS process monitoring
The only prerequisite for configuring OS process monitor in Health Monitoring is that you should have registered the host and deployed Simple Diagnostic Agent (SDA) on the host where you want to monitor the critical process.
Setup of OS process monitoring
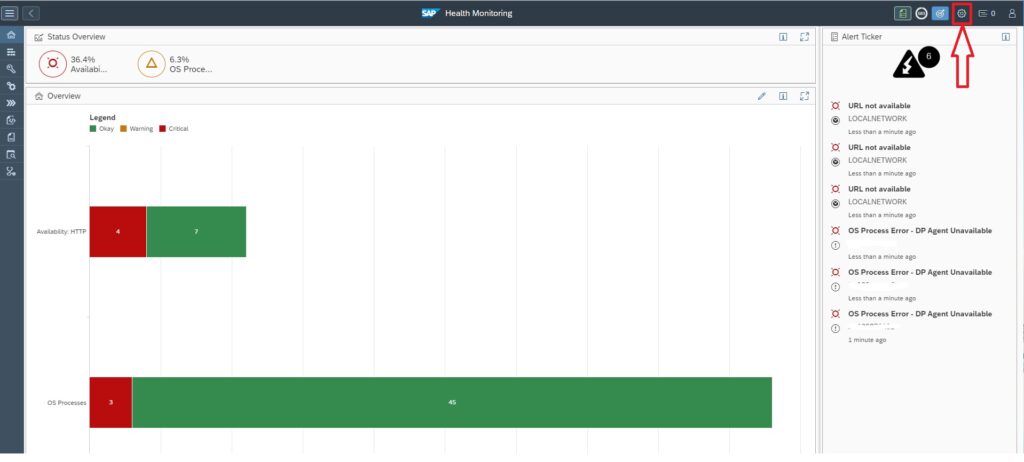
For setting up the OS process monitor you need to navigate to the settings page of the Health Monitoring App.
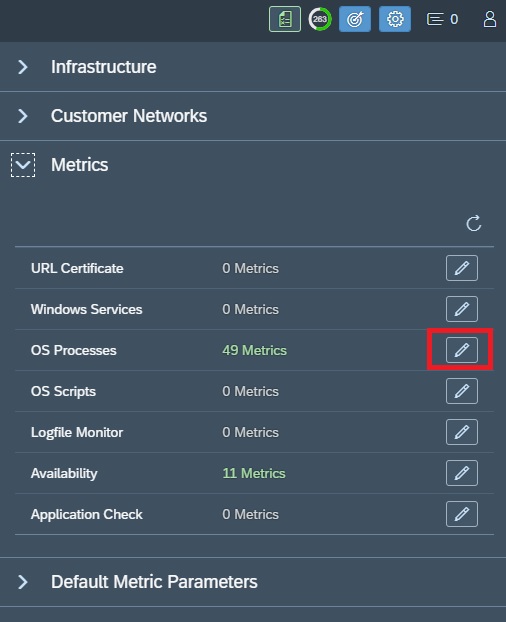
In the settings area expand the metrics node and click on the pencil button (Edit Metric) for OS Processes.
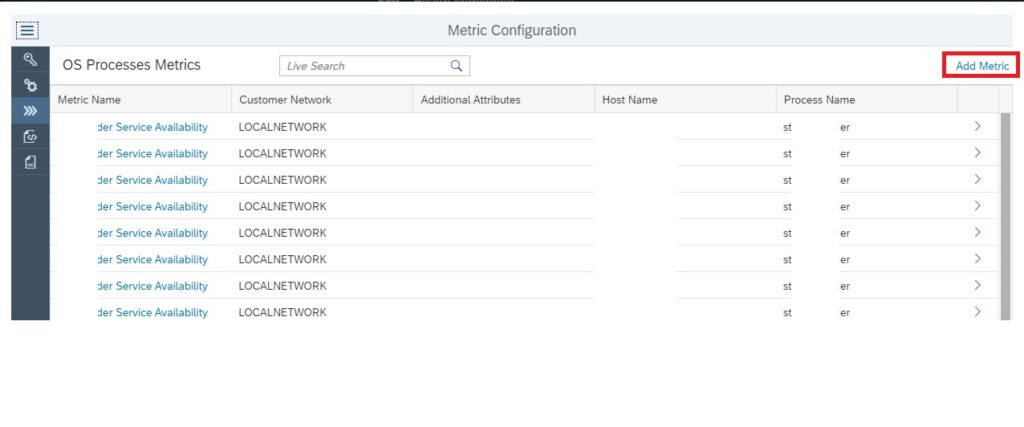
In the OS Process edit metric screen click on Add Metric button to start creating the OS Process Metric.
In the OS Process edit metric screen click on Add Metric button to start creating the OS Process Metric.
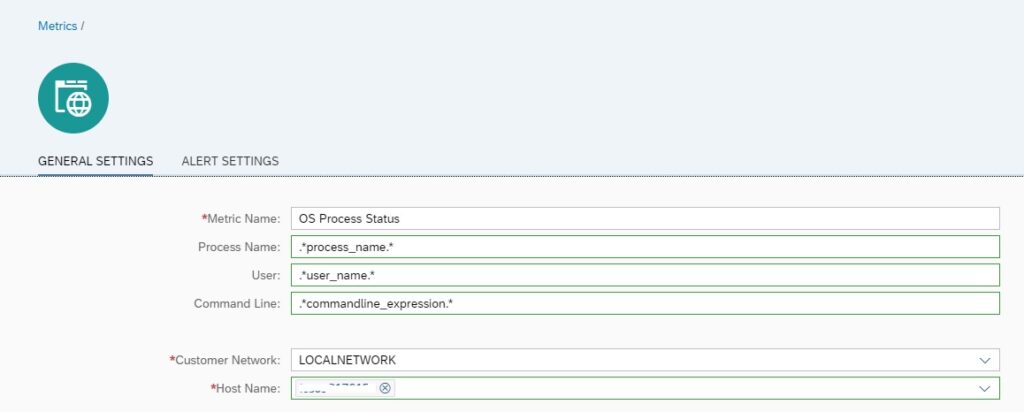
| Field | Description |
| Process Name | Name of the OS process. This parameter needs to be maintained as a regular expression. SDA will use this expression for searching for the respective OS process at OS level. |
| User (Optional) | You can further restrict the search for processes running through a specific user. You need to enter the name as a regular expression |
| Command Line (Optional) | You can further restrict by the specific command line with which the process is running . This is specifically useful if there are multiple processes running with the same name but you want to monitor the process which is running with a specific argument or parameter. This also needs to be maintained as regular expression. |
| Hostname | Name of the host where the process to be monitored. You can select from a list of all hosts connected (also SDA deployed) to the Focused Run system. |
In the General Settings tab you can also specify the data collection frequency and the threshold. By default 5 minutes frequency and Already Rated threshold is set.
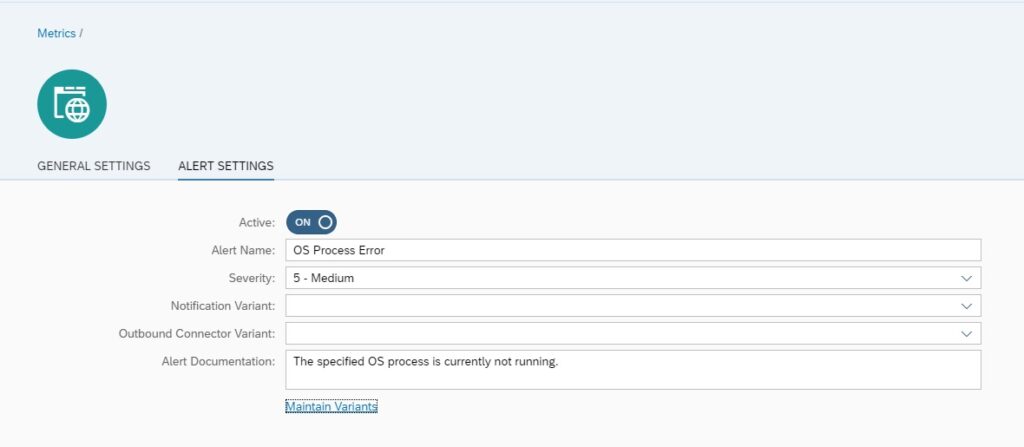
Optionally you can update the alert settings for this metric in the Alert Settings tab. By default alerting is active with medium severity.
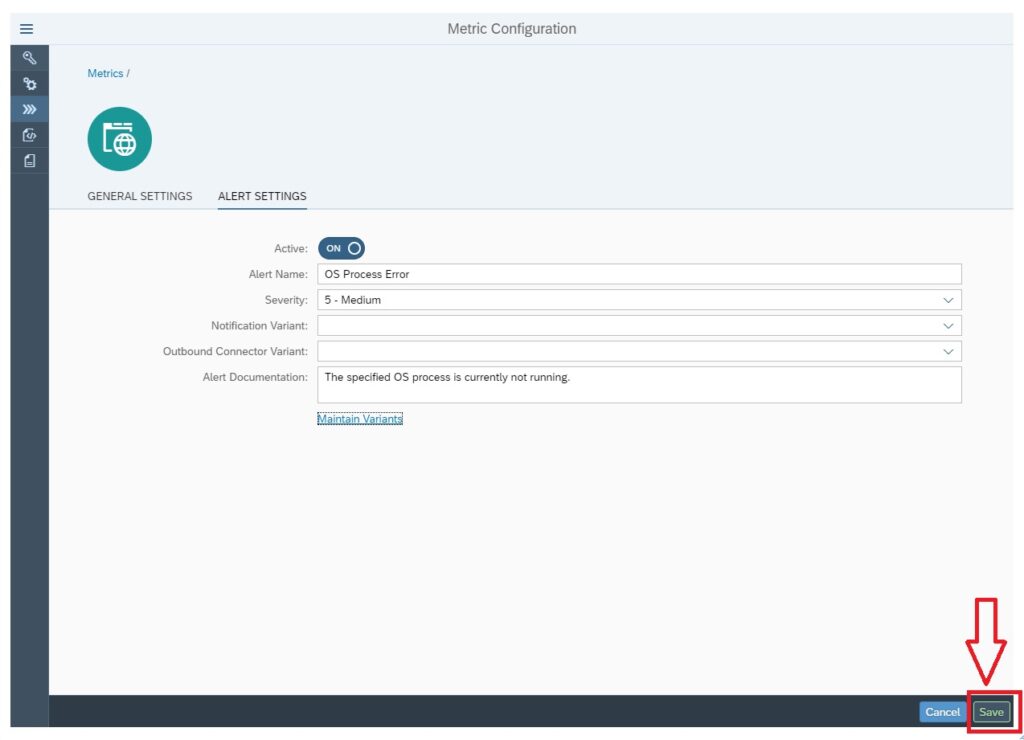
After entering all details, to activate the metric click on Save button.
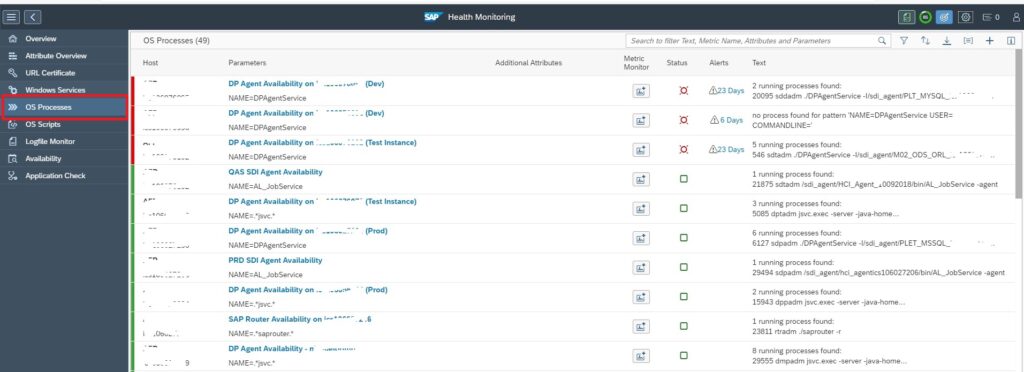
You can monitor all you OS process metrics in the OS Processes tab of the Health Monitoring App.
SSL certificate monitoring
You can configure monitors to monitor the SSL certificate of a URL using Health Monitoring functionality in SAP Focused Run system. This monitor measures the remaining validity (in days) of a SSL certificate for a https call to a URL. The URL is called by Simple Diagnostics Agent of a designated host in your customer network.
The Health Monitoring app also provides a separate section called as URL Certificate Monitor where in you can centrally monitor expiry of SSL certificates of any https URL.
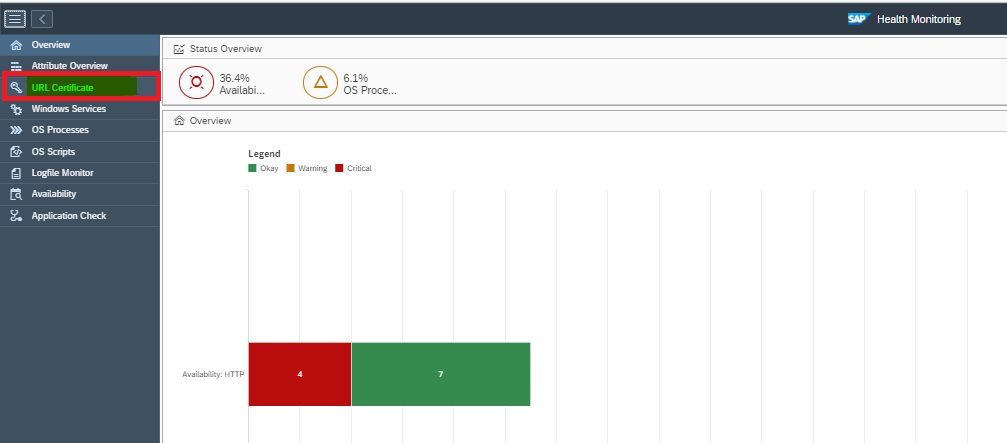
To navigate to URL Certificates monitor you can click on the URL Certificate button as shown below in the navigation panel of the app.
Setup of SSL certificate monitoring
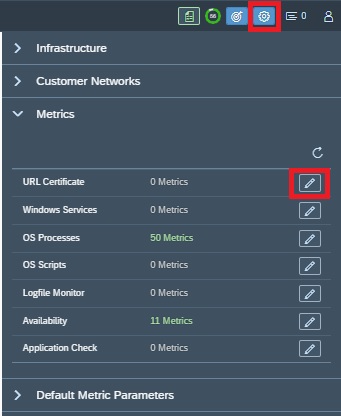
To configure URL Certificate monitors , navigate to the Configuration area, expand the Metrics node and click on the change button.
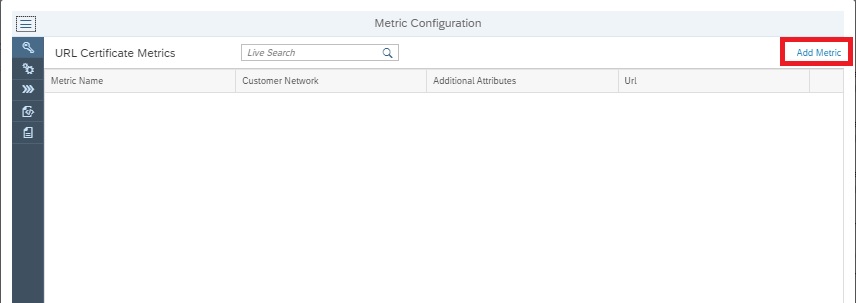
In the popup window click on the Add Metric.
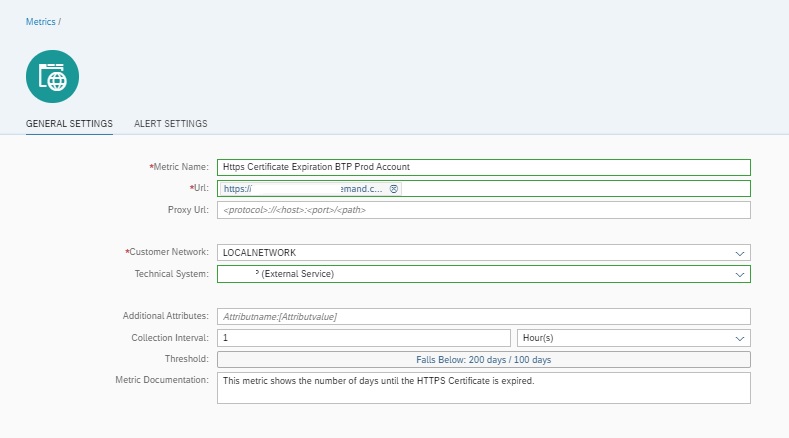
In the Metric Configuration window enter the following details in the General tab.
| Field | Description |
| Metric Name | A meaningful name to the monitor |
| URL | URL whose certificate to be monitored. |
| Proxy URL (Optional) | The Proxy URL if the URL is accessible via a proxy URL |
| Customer Network | The Customer Network to which this URL belongs. The designated SDA from this customer network will be performing the check. |
| Technical System (Optional) | You can optionally link this monitor to a specific cloud service you have registered in your LMDB. This is the Cloud Service you would have created if you are using AIM scenario for Cloud Service Monitoring. Select from the drop down. |
| Collection Interval | Frequency of data collection. Select from available options. |
| Threshold | Threshold for remaining days for expiry. By default 200 Days for Yellow and 100 days for Red. |
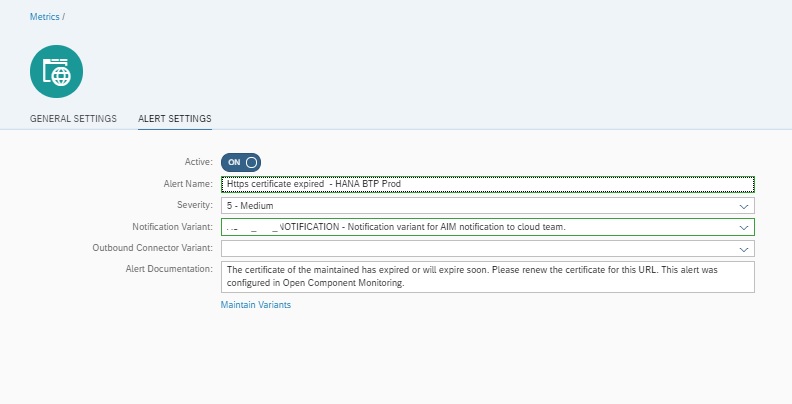
Additionally and optionally in the Alert Settings tab you can activate alerting and notification settings as shown below.
That’s it, now your monitor is active.
Using SSL certificate monitoring
To monitor navigate to the URL Certificate tab in the Health Monitoring App.
You can also refer to this SAP documentation to know more about various features available with Focused Run Health Monitoring.
<< This blog was originally posted on SAP Focused Run Guru by Manas Tripathy and Frank Umans. Repost done with permission. >>






Insightful overview of SAP Focused Run monitoring. Clear and informative. Thanks for providing valuable insights into SAP operations!