This blog will give you and overview of the functional capabilities of the System Monitoring in SAP Focused Run.
Questions that will be answered in this blog are:
- What are the main functions of System Monitoring?
- How to zoom in on systems and specific metrics?
- How to optimize the scope selection?
- How to use the tabular view?
- How to check a specific metric across multiple systems?
- How can I quickly get an overview of all my systems that are down?
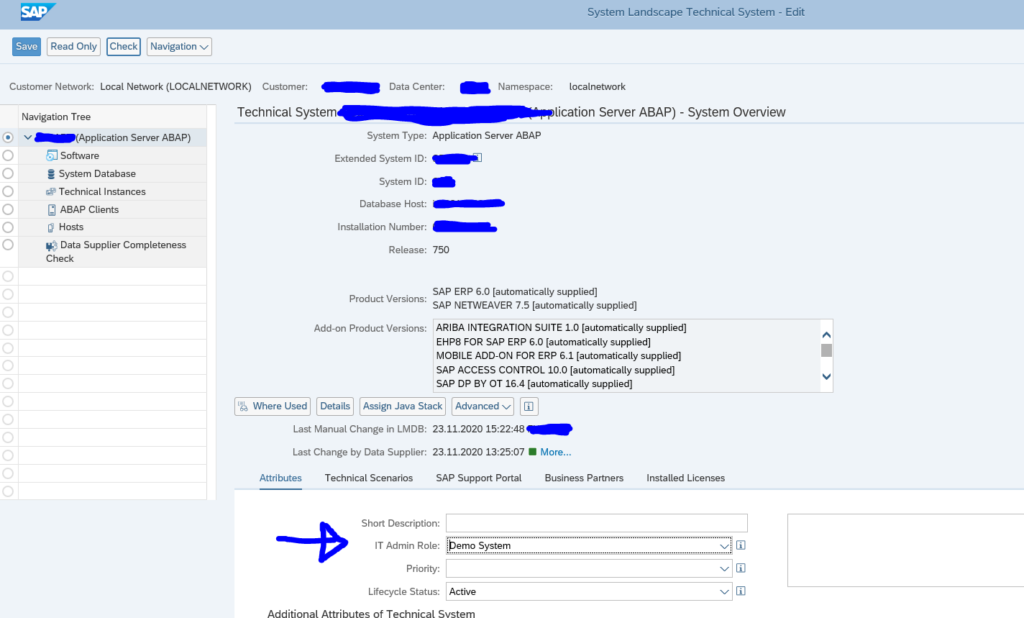
- How to set IT admin role of systems in LMDB?
- How to store specific metric data longer?
- How to use the aggregation framework?
System monitoring top down approach
From the Advanced System monitoring group in Fiori launchpad, select the System Monitoring tile:
Now select the systems in the Scope Selection block, for which you want to see the monitoring data:
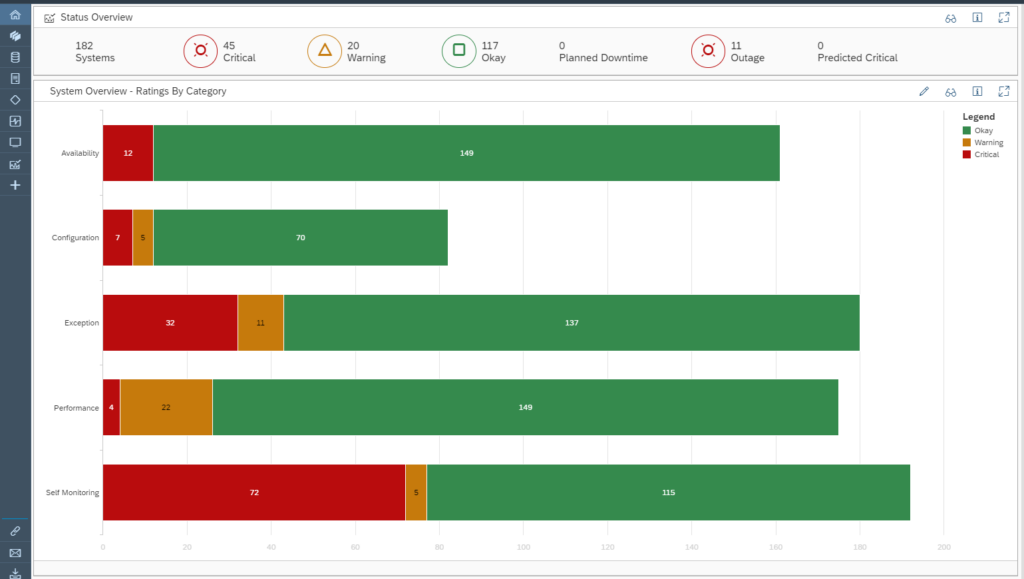
Select Go when you finished your filtering. You now reach the overview screen:
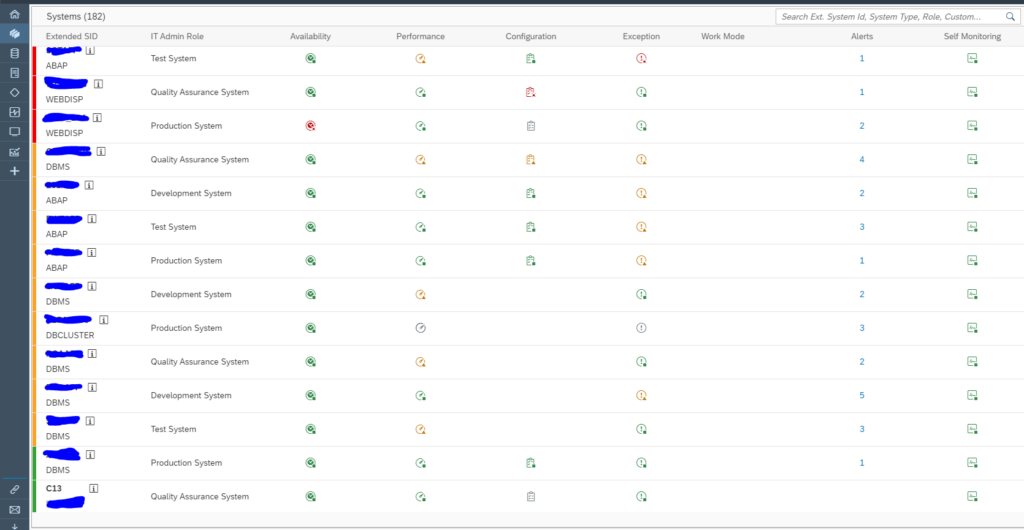
If you want to zoom in click on one of the numbers, or select the Systems button from the left hand toolbar:
The traffic lights indicate where the issue or issues are: availability, performance, configuration or exceptions. If you want to go directly to an alert click on the alert number. Alerts are explained in full in this blog.
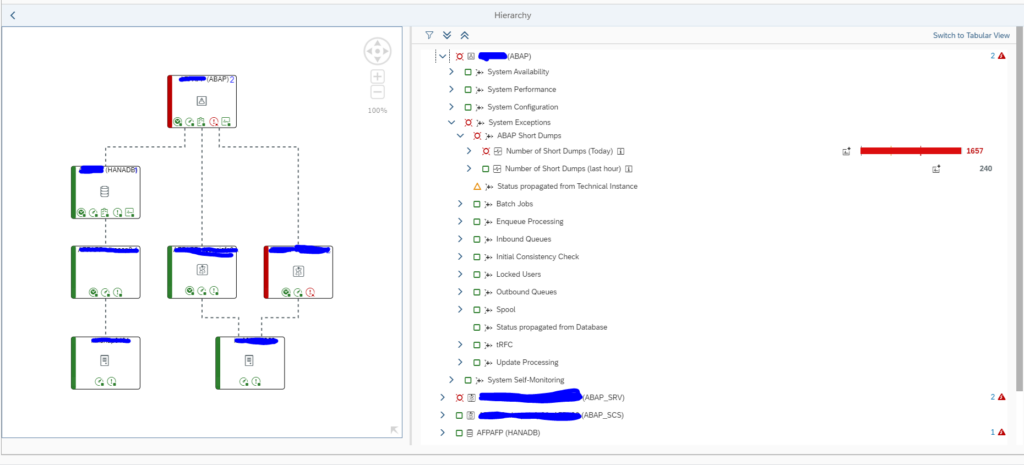
Click on a single system in the left column to open the system monitoring view for a single system:
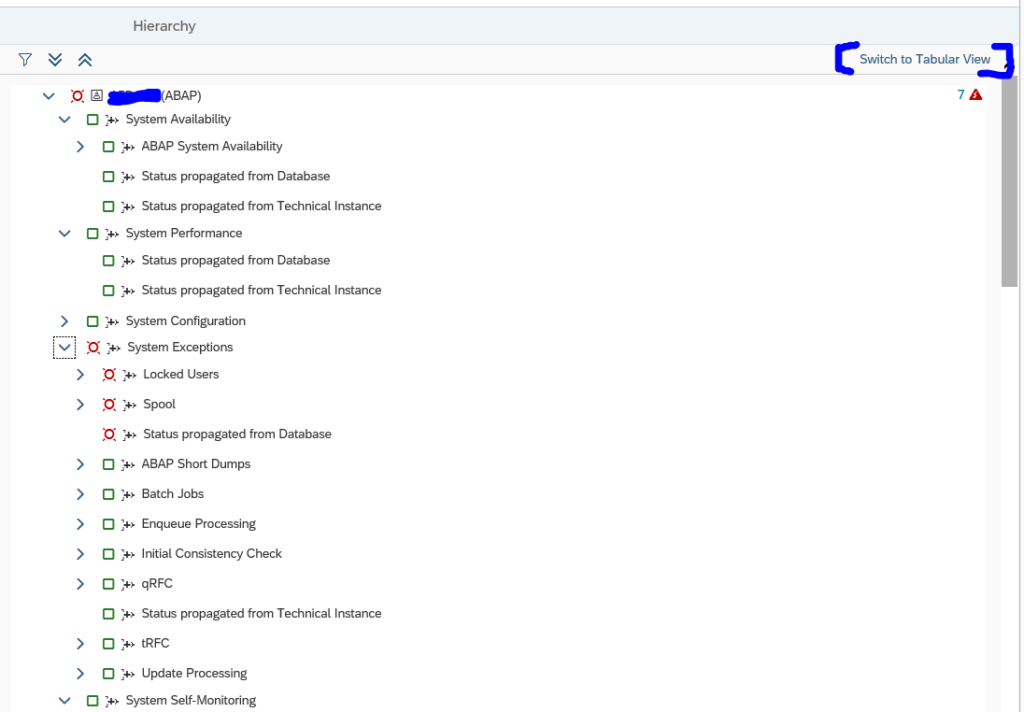
On the left hand side, you can see the application (in this case ABAP) on top. You can also see the database (HANA) and application server, CI and their hosts. On the right hand side in a tree structure you can see the diverse checkpoints and issues in the system. The checkpoints are called metrics and they are clubbed together into logical blocks (like system exceptions, performance, availability). In this case there is a system exception due to too many short dumps today.
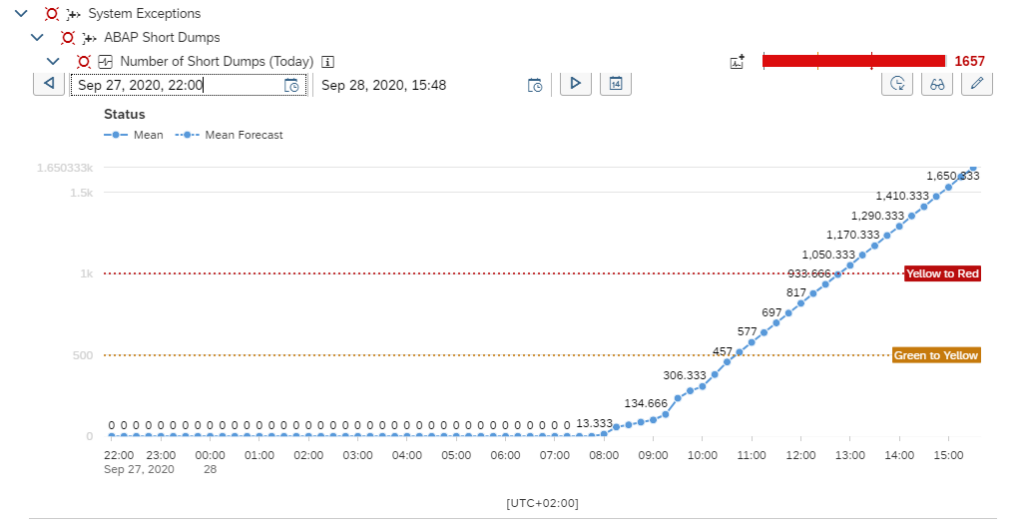
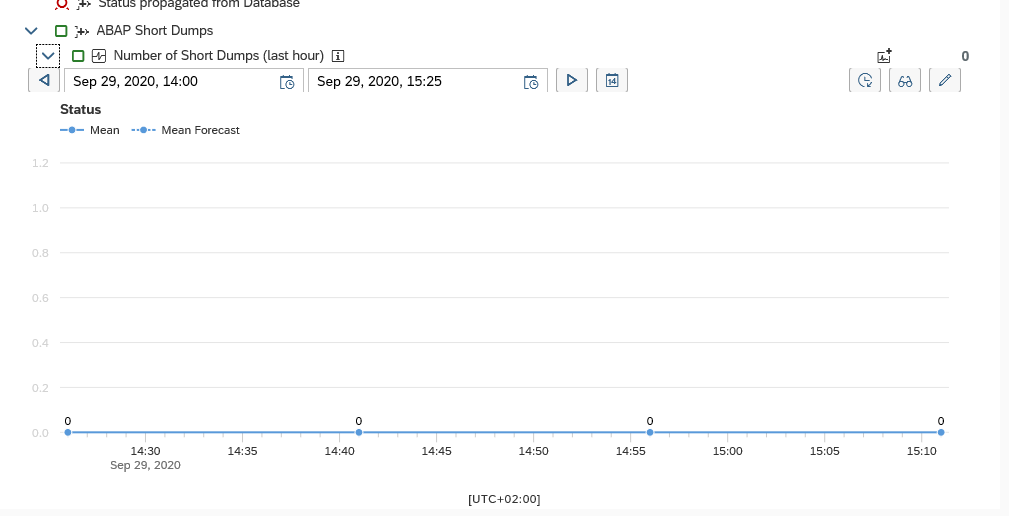
You can open the graph for this metric to see the details in time:
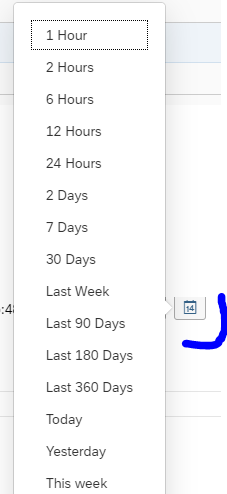
By clicking on the start and to date, you can select the date/time range or use the Select Time Frame button for a predefined time range:
Optimizing scope selection
In the scope selection of systems, you can create a few variants to speed up your work.
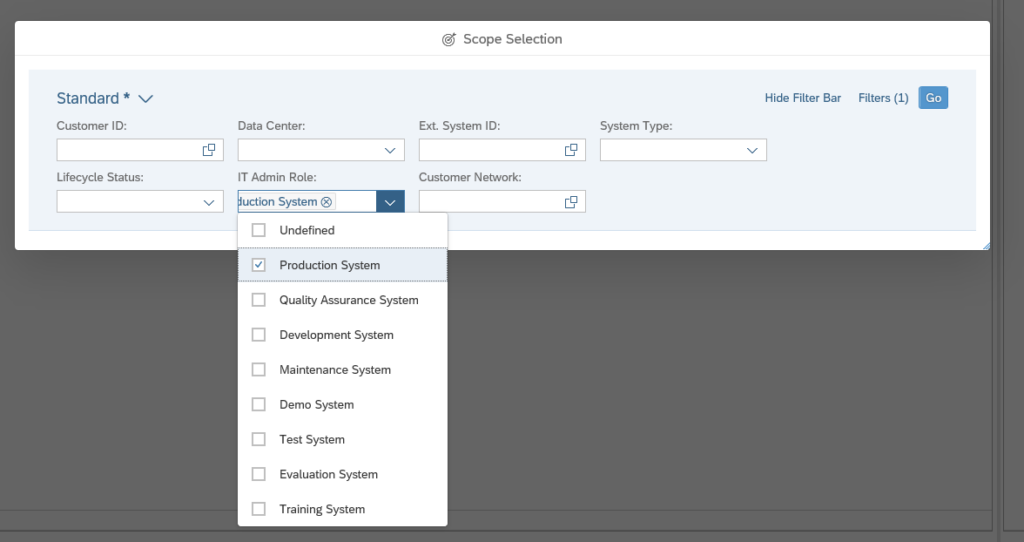
In this example we will setup a variant to quickly select all productive systems. In the scope selection block select the IT Admin Role for Productive System:
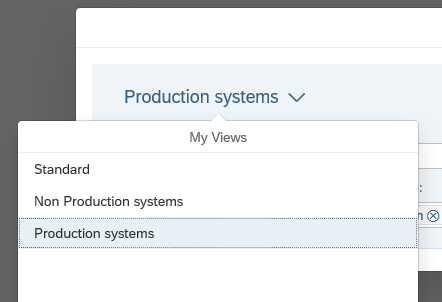
Now select the down arrow next to Standard in the top left corner and select Save As:
You can choose to set this variant as default. Setting it as public will make the variant available for all users. Selecting the Apply Automatically tickbox will apply this specific variant immediately. This might be preferable, or annoying. Just try it.
Upon pressing Save you will get a request for transport popup or save it as local request.
You can also create a similar view for non-production systems.
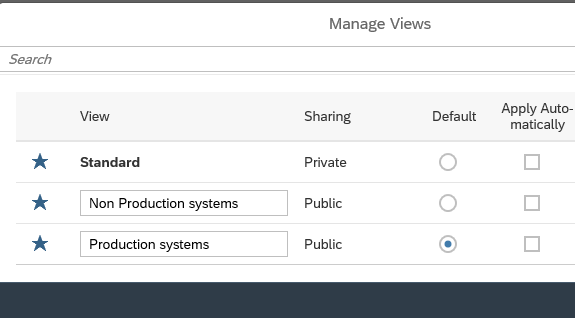
In the end you can always press the Manage button to change the variants and texts:
Now you can easily switch between scopes for production and non-production:
How to set IT admin role of systems in LMDB
This chapter will show how you can set the IT Admin role of a system in LMDB. Goals is that you can use it easily as described above in the scope selection.
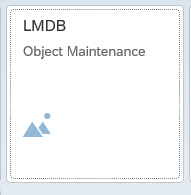
Go to the LMDB Object Maintenance Fiori tile:
Search for your system:
Select the system and press Display to open the detail screen:
Press Edit to change. Now change the IT Admin Role and press Save.
Using the tabular view
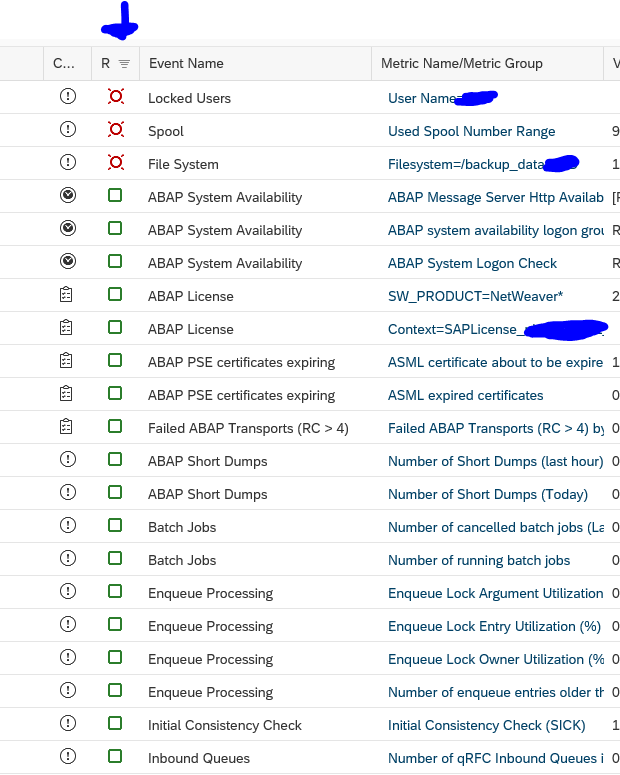
In stead of using the hierarchy view, you can also switch to the Tabular View:
In this view you can for example sort the items on a column like the traffic light:
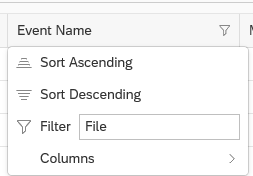
Or you can apply a text filter to search for a specific metric:
Checking a metric across multiple systems
If you have an issue in one system, you might want to quickly validate if you have similar issue in different systems, or you simple want to compare with different systems. From the monitoring of a system select the metric.
For this example we selected Short Dumps:
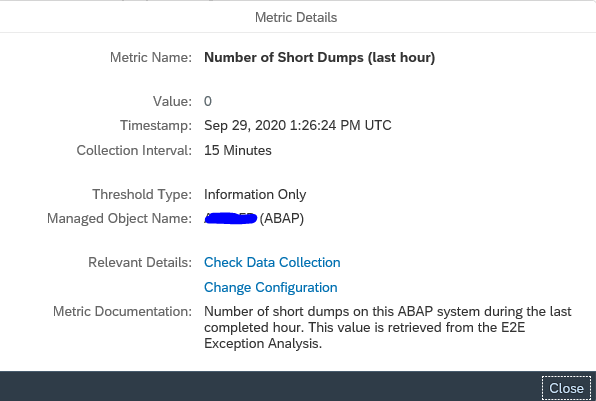
Select the i button to get the explanation text:
This gives the exact name:
Now goto the metric tool:
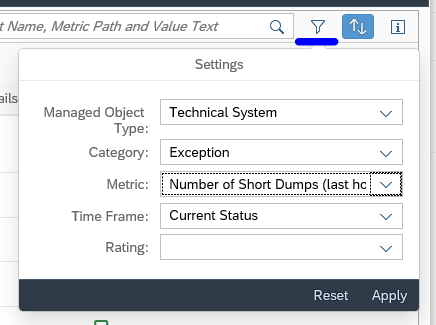
If you don’t see the correct metric, use the metric selection filter on the top right of the screen:
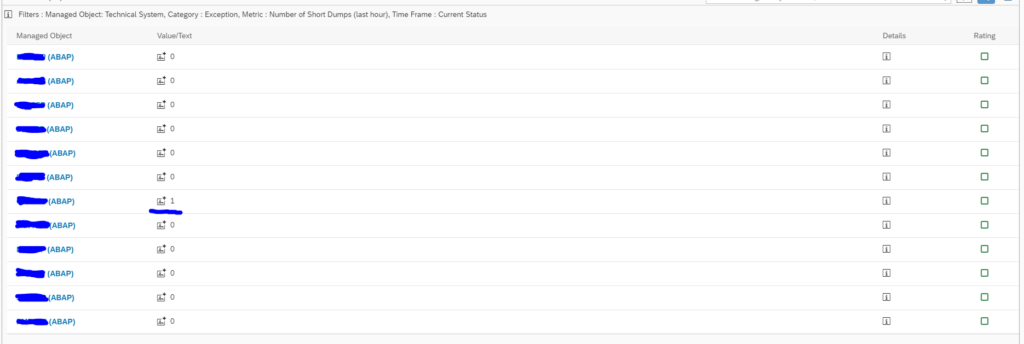
Press Apply, and you get the overview of this specific metric across all systems in your selected scope:
Storing metric data longer
Focused Run stores the monitoring data 28 days. If you need the data for specific metrics and systems longer, you can make use of the aggregation framework.
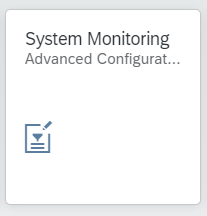
Start the Fiori application for Advanced Configuration of System Monitoring:
On the left hand side choose the option Aggregation Framework:
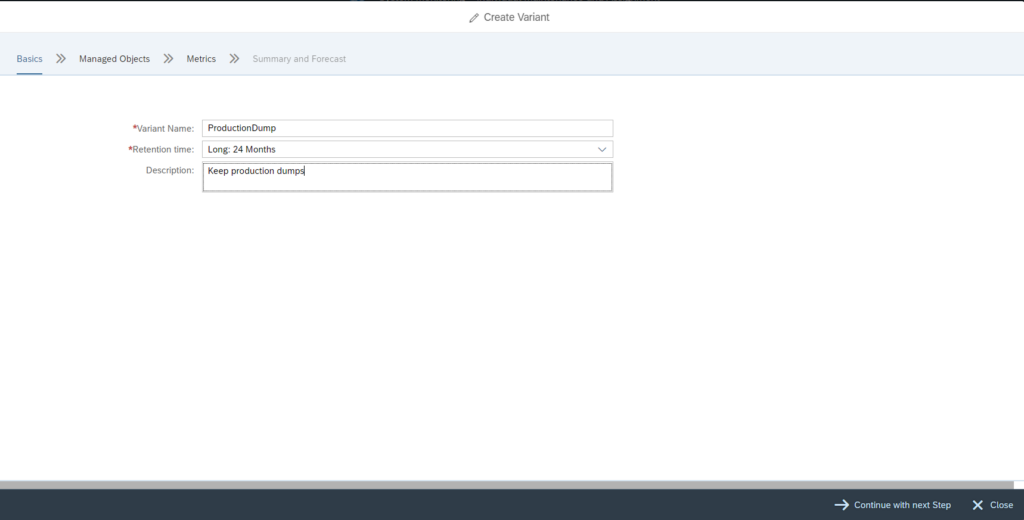
Choose the button Create Variant to create a new variant:
Fill out the name and basic description and press the Continue with next step button:
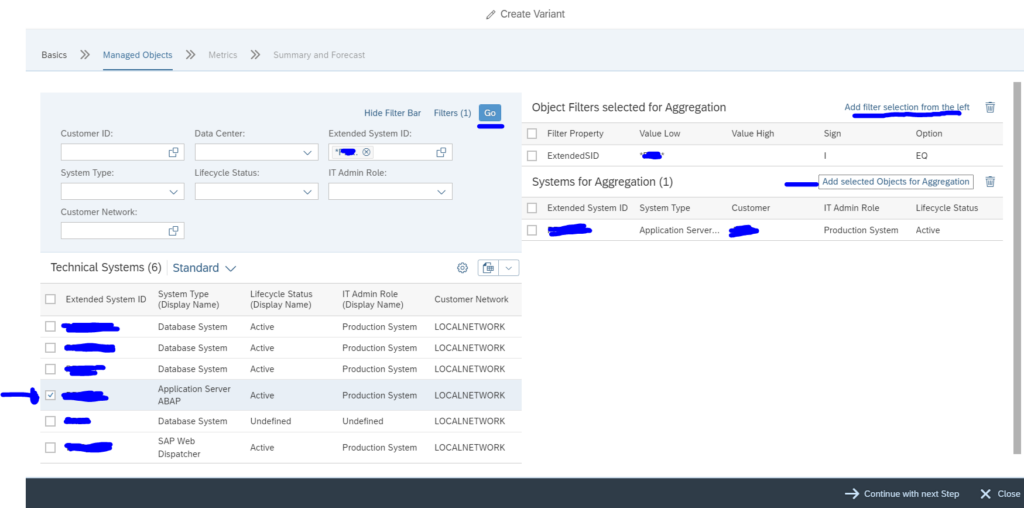
The next screen is bit more complex:
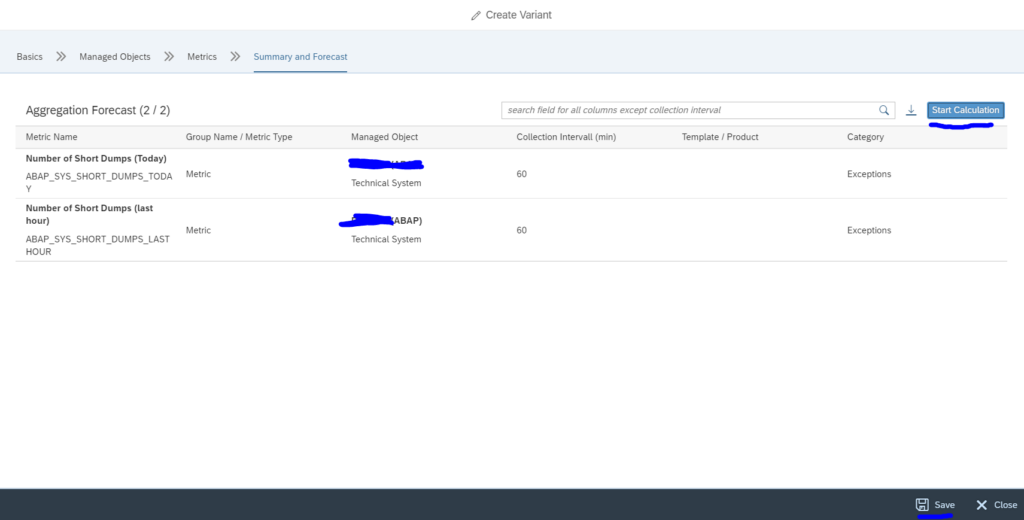
In sequence: first search for the extended system ID and press go in the top left section. In the bottom left section, select the system you want. In the top right section now select Add filter from the left button. And press the Add selected objects for aggregation button on the bottom right part. Now press the Continue with next step button:
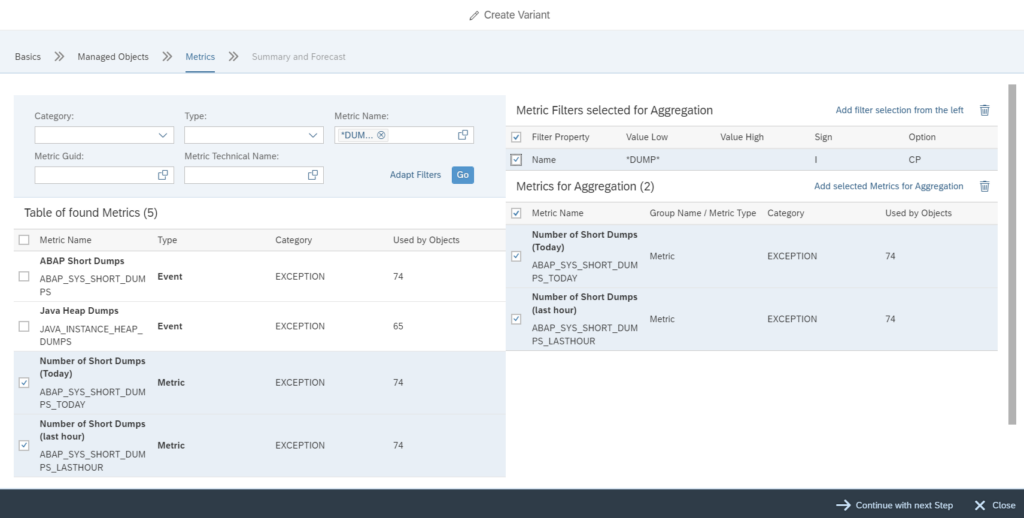
Select the metrics on the left hand side and add the filters on the right hand side. When done press the Continue with next step button:
Using the aggregation framework
For using the aggregation framework there are no special requirements. Whenever you use an aggregated metric in system monitoring, you can simply use the details with a long period.
Settings for the aggregation framework
In the aggregation framework configuration screen, you can click on the configuration wheel top right to set the retention period for Short/Medium/Long:
System down monitor
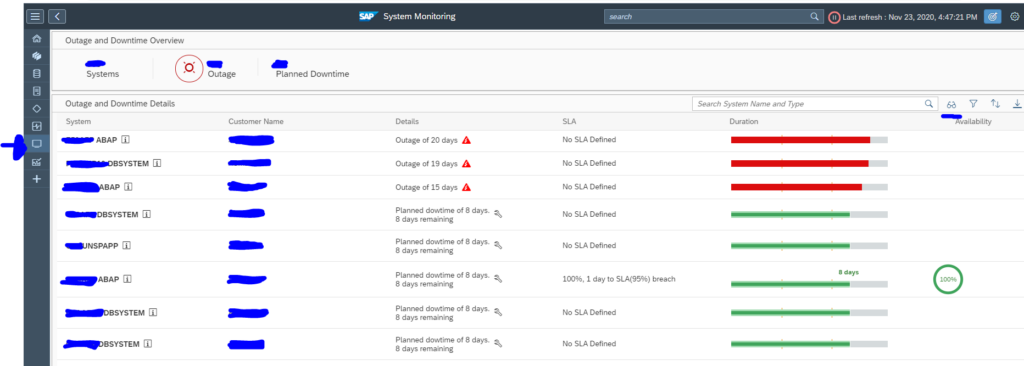
A special function is System Monitoring is the System Down Monitor. This overview directly gives an overview of the systems that are considered down by SAP Focused Run and the systems which are set to having maintenance.
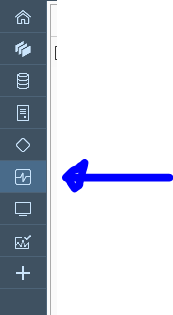
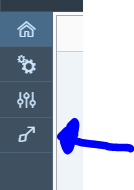
In the system monitoring screen select the System Down monitoring icon on the left icon bar (here indicated with the arrow):
You can see systems that are down and which ones that are having planned maintenance. If you have set up the SLA management, it will also show that aspect.
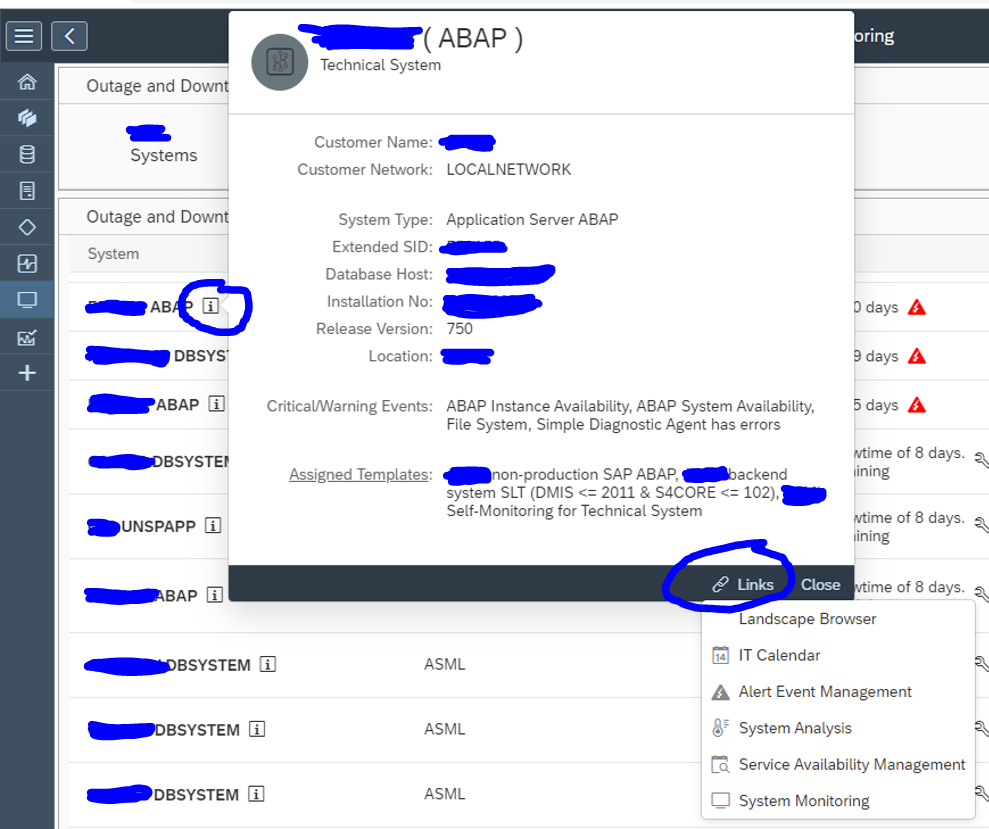
If you want to zoom in on the issues, press the i icon right of the system. Then select Links to go to the respective tool for further investigation:
For systems down the best tools are usually the System Analysis and the Alert Event management.
Changing settings
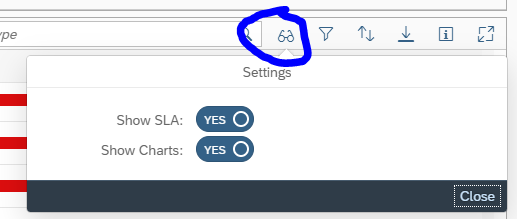
You can change the layout settings with the glasses icon:
You can show/hide the SLA and charts section as per your need.
Definition of down
The definition of down is in Focused Run: any red alert in the availability metrics. This can be:
- Complete system down
- One of the application servers is down
- A core function is down (for example ABAP stack is up and running, but the Https port is not available)
- Important subfunctions are not working (for example in the SLT system 1 or more source systems can not be reached)
Relevant OSS notes
Summary
The overview above gives the top – down approach in full: from the total landscape, to single system, to group of metrics to single metric.
<< This blog was originally posted on SAP Focused Run Guru by Frank Umans. Repost done with permission. >>





Informative overview! Appreciate the insights into SAP Focused Run system monitoring. Valuable resource for SAP administrators. Thank you!