SAT ABAP runtime analysis for ABAP web applications

SAT ABAP runtime analysis is a great tool for analyzing performance issues. This tool can also be used to analyze ABAP web dynpro and FIORI applications. For more background on SAT tool itself, read this blog.

Questions that will be answered in this blog are:

  • How to run SAT tool for ABAP web applications?

Running SAT tool for ABAP web applications

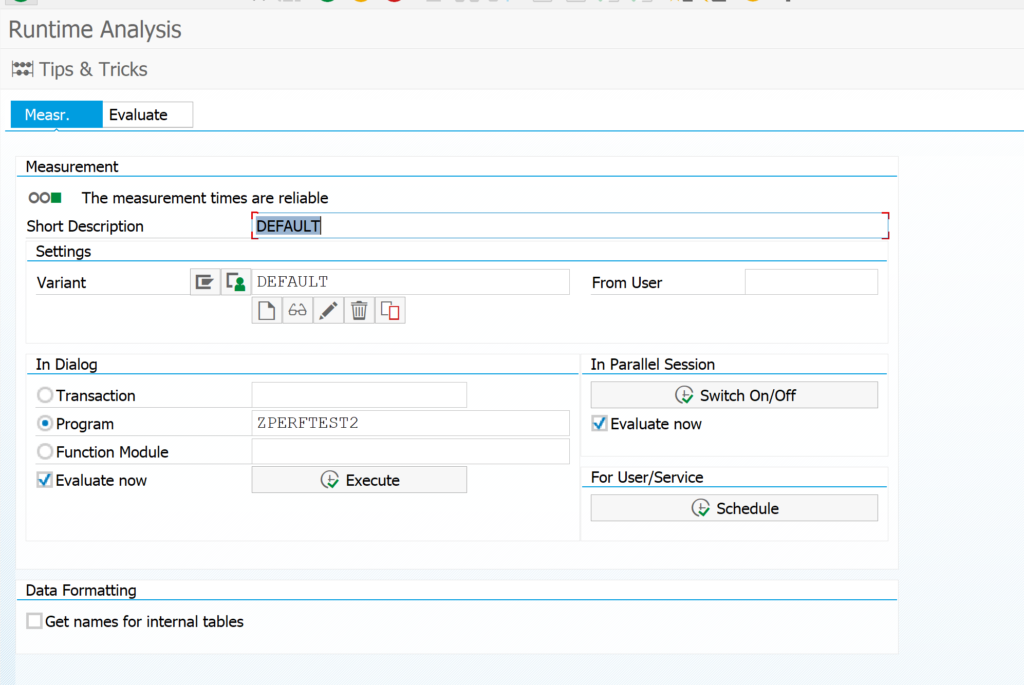
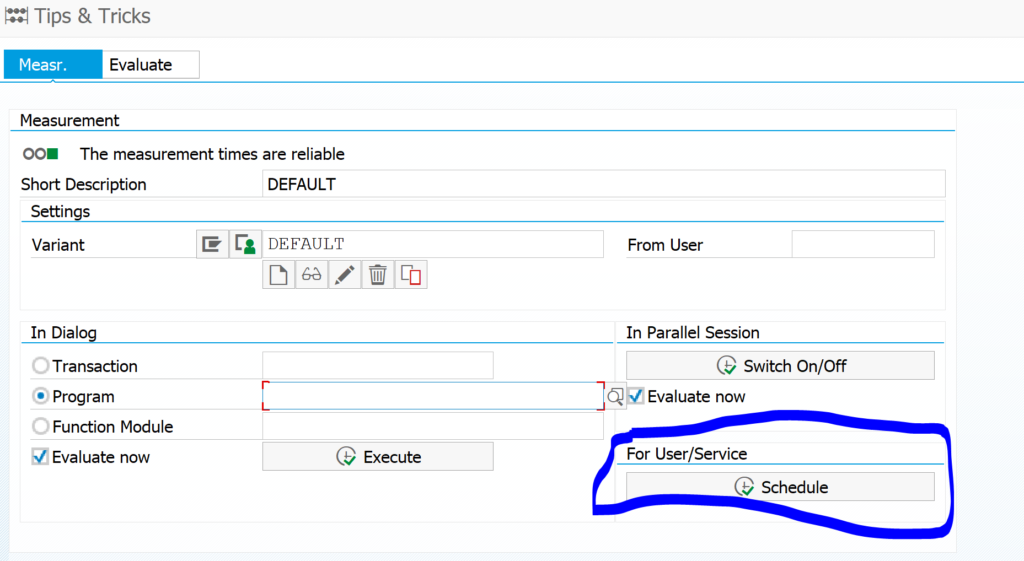
Start transaction SAT, and press the button Schedule in the block For User/Service.

You now reach the measurement overview screen:

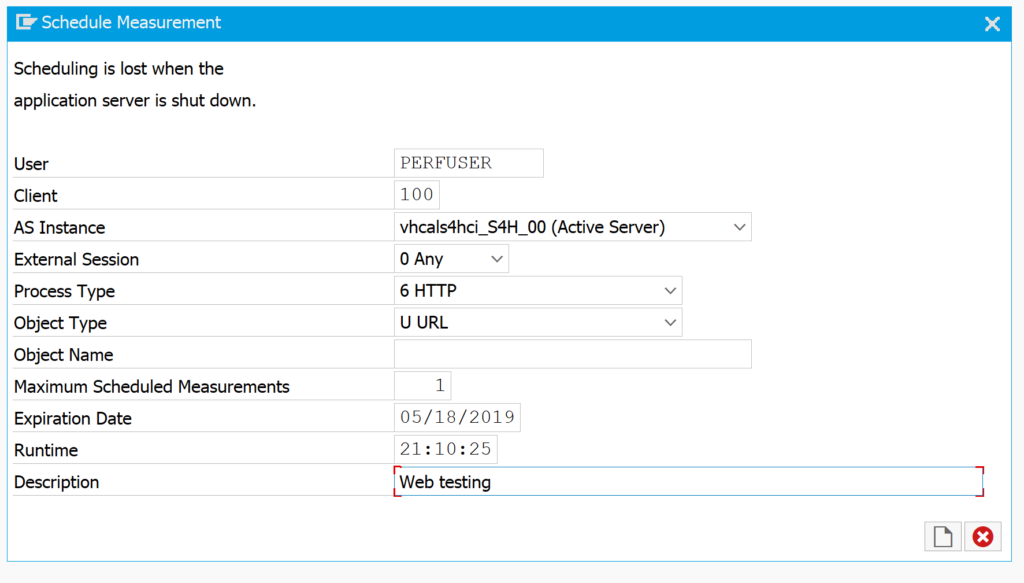
Now select the Schedule Measurement button. In the next screen fill out the user to trace and very important: switch the object type to URL and process type to HTTP:

Do not press the schedule measurement button yet. First go to the ABAP web application to the part you want to measure for performance. Afterwards delete the browser, since it will keep on sending data.

No you have to go back to the SAT start screen and click on the tab Evaluate:

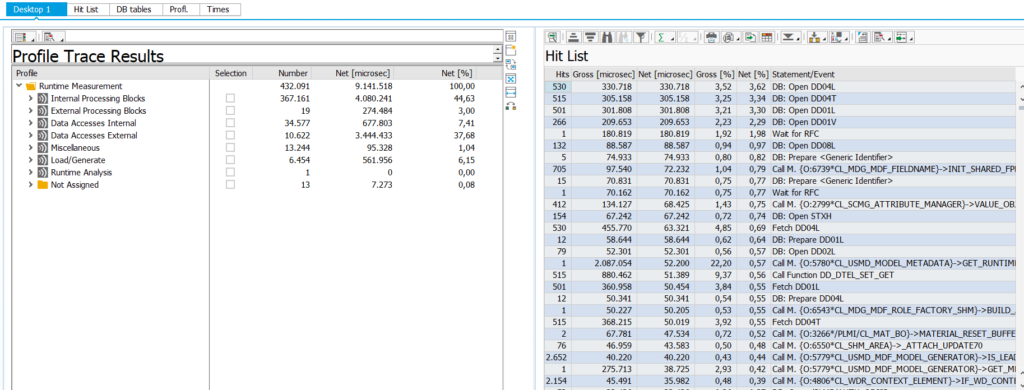
Double click on your measurement line. The system will now read the measurement log files and process them. This can take some time. The end result screen looks again like a normal SAT result screen:

SAT ABAP runtime analysis

The SAT ABAP runtime analysis tool can be used to identify performance problems in ABAP programs.

Questions that will be answered in this blog are:

  • How to run the SAT tool?
  • How to read the results of the SAT tool?

Starting the SAT tool

The SAT ABAP runtime analysis tool can be started with transaction SAT:

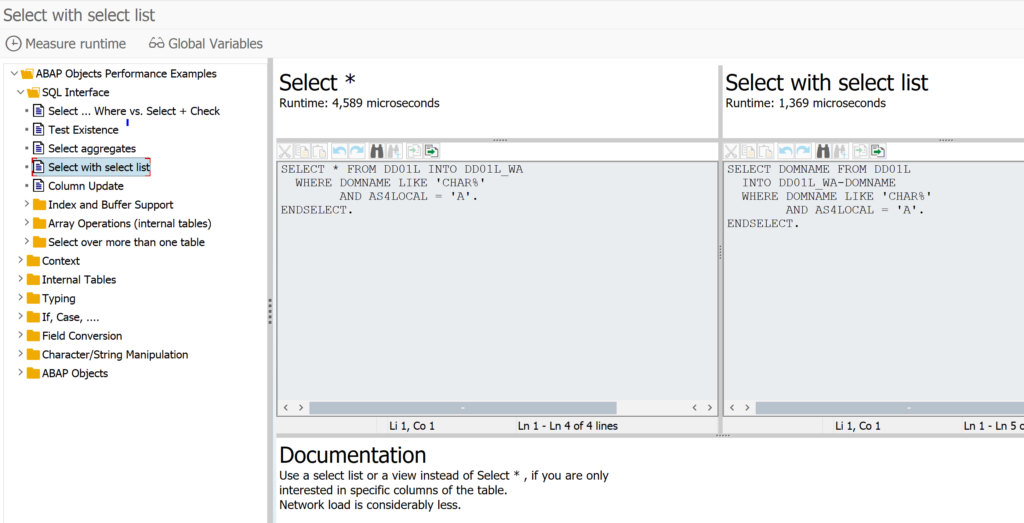
Top left there is a Tips & Tricks button. This will bring you the to the following tool:

Here you can compare the optimal and not optimal way of coding. By hitting measure runtime button you can actually compare in real time the difference between the 2 methods.

The performance issue program

To test the tool, we first write a simple test program:

REPORT zperftest2.

DATA: zlt_vbak TYPE TABLE OF vbak.
DATA: zls_vbak TYPE vbak.
DATA: zlt_vbap TYPE TABLE OF vbap.
DATA: zls_vbap TYPE vbap.
DATA: zls_vbap2 TYPE vbap.

SELECT * FROM vbak INTO TABLE zlt_vbak UP TO 100 ROWS.

LOOP AT zlt_vbak INTO zls_vbak.
  SELECT * FROM vbap INTO zls_vbap.
    DO 10000 TIMES.
      zls_vbap2 = zls_vbap.
    ENDDO.
  ENDSELECT.
ENDLOOP.

Now we start the SAT tool, enter the program name. Make sure the tick box evaluate immediately is on and press Execute.

Now the measurement will start.

Result of the trace tool

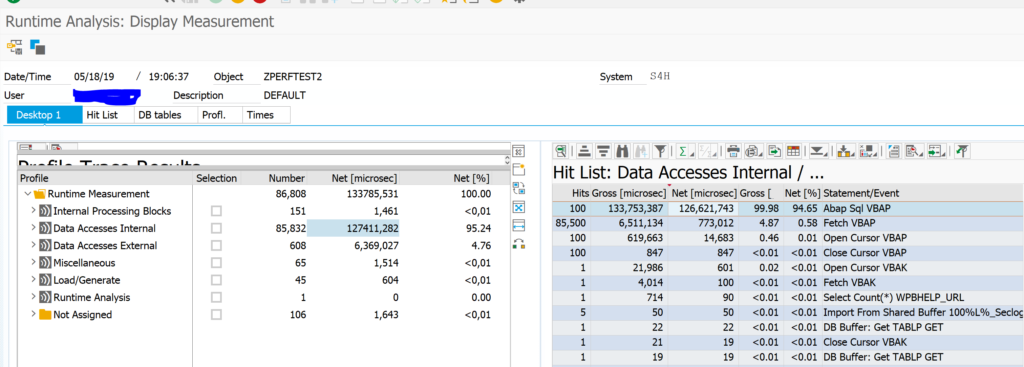
The result of the trace tool is as follows:

On the left side you see the split in where the program spends it time. Here you can see that most of the time is spend on internal processing and not on SQL statements. SQL statement can be analyzed from the SAT tool or from the ST05 SQL trace tool.

By double clicking on the the internal access the right hand side of the screen is filled. Here you can see in which code blocks the most net and gross time is spent. It does not always point you to the exact statements that are not ok, but it can point you to the program that is causing the biggest delay.

In our case the DO 10000 TIMES loop is the performance killer. With only SQL tracing this cannot be found.

Runtime analysis for web applications

For runtime analysis for web applications, read this dedicated blog.

Relevant OSS notes

Check and if needed you can apply these OSS notes to solve bugs in the SAT tool: