This blog explains how to use the SWLT performance tuning worklist to find poorly performing Z code by combining SQL monitoring data from production and ATC results.
Questions that will be answered are:
- How to setup the SWLT performance tuning worklist tool?
- How to analyze the results from the SWLT performance tuning worklist tool?
Preparations
As preparation for the SWLT tool you must have run the SQL monitor in a productive system and created a snapshot of the data. This snapshot you can export and import in a development system (see note 2700312 – How to import SQL Monitor (SQLM) extracted data). In the development system you configure and run the ATC code check tool.
The SWLT performance tuning worklist tool will combine these results. As example we will use this poorly written Z code:
Running the SWLT tool
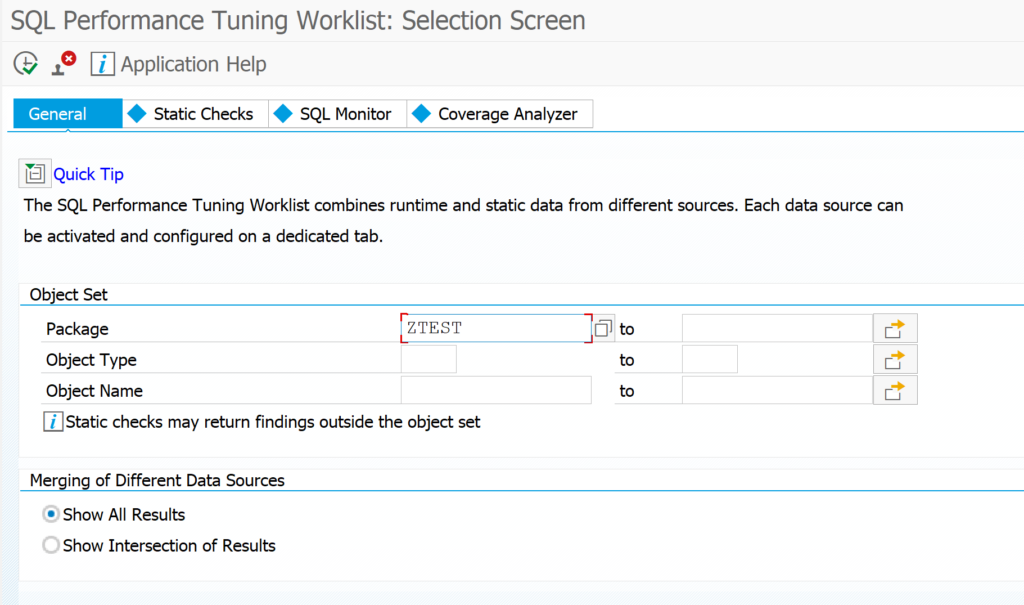
Start transaction SWLT:
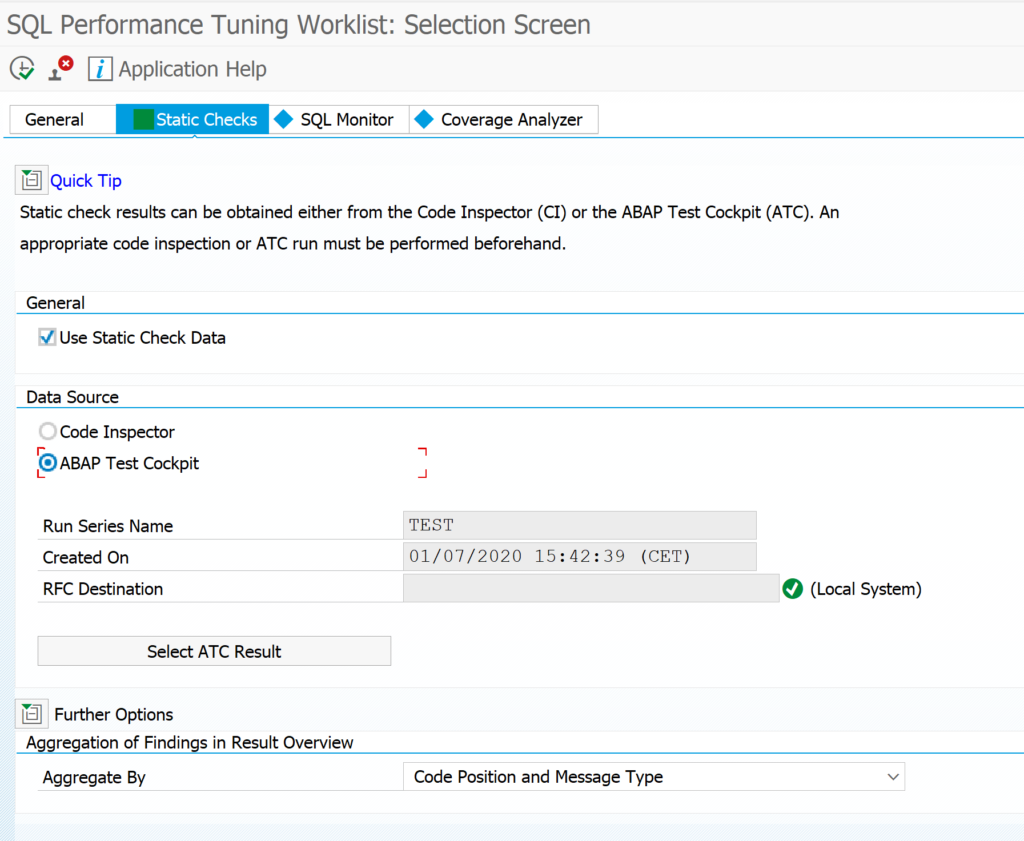
You can reduce the scope by just taking the needed Z packages. Goto the tab Static Checks to select the appropriate result of the ATC run (for more on ATC read this blog):
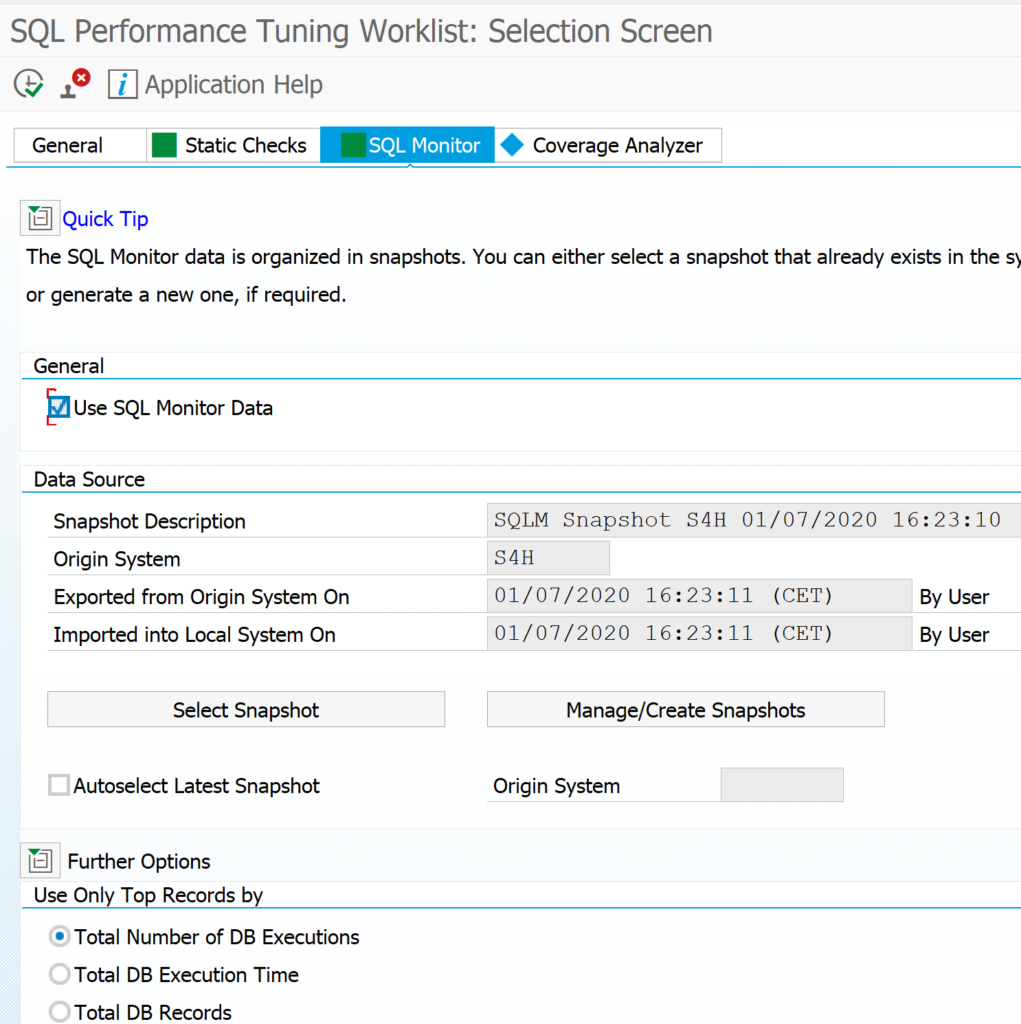
Now select the SQL monitor tab to select your SQLM data snapshot you took from your productive system:
Now that all data is loaded, you can hit the execute button to start the SQL performance tuning worklist.
It might be you don't see the SQLM snapshot in SWLT. In that case create a new snapshot from SWLT directly.
The tool will now start to merge the results. In the example above you can see the following result:
In the total result select a line. On the bottom left you can see the SQL monitor results. Bottom right you can see the ATC check result. Clicking on the underlined program or SQL statement will bring you to the poorly performing ABAP code point.
Bug fix notes
3060630 – Runtime error RUNT_INTERNAL_ERROR while fetching SQLM data (e.g. via SWLT)


