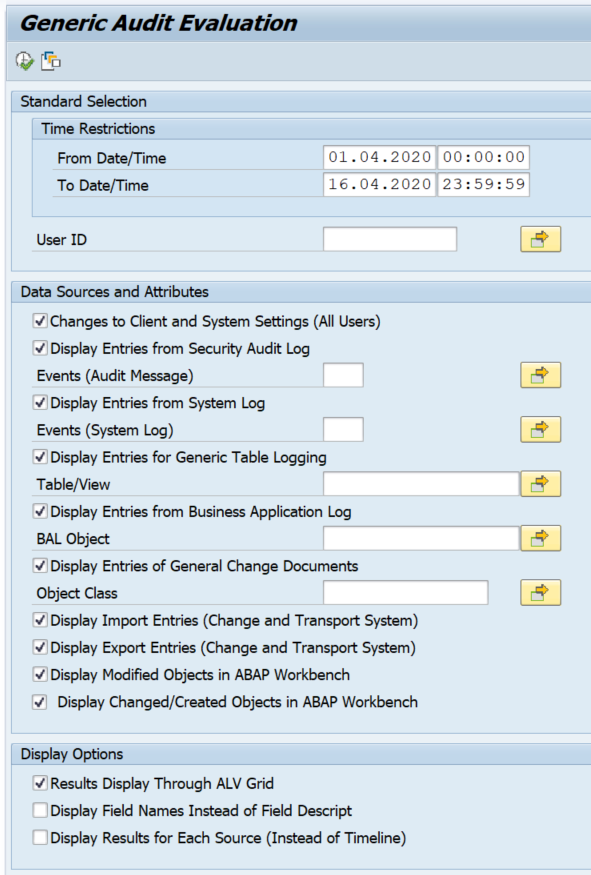
SAIS_MONI is a central audit report about system changes. It collect changes from client opening, audit log, change log, transport log and more, in one central place.
If you have configured attachments of document info records to be stored in the content server, you still might have a lot of old document stored into the SAP database.
This blog will explain how to migrate these documents from the database to the content server.
Questions that will be answered are:
How to migrate documents from database to content server?
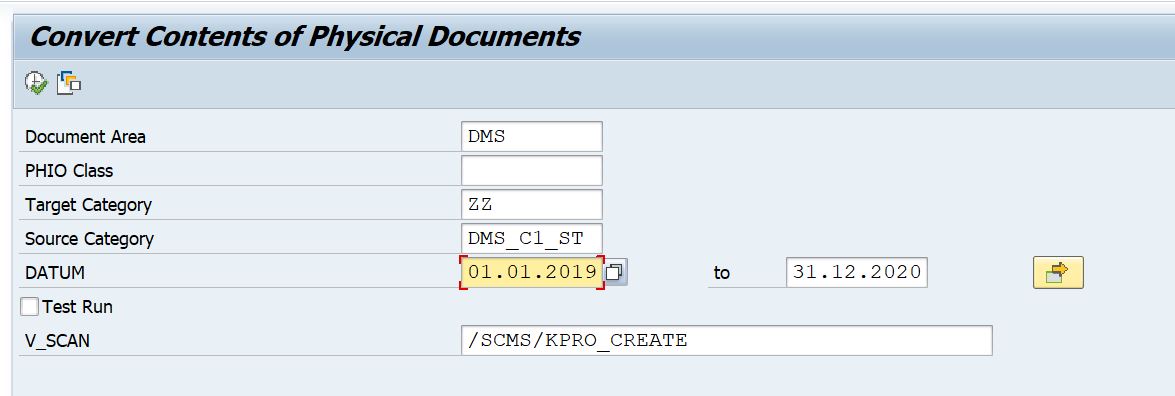
To run start transaction SE38 and start program RSIRPIRL and fill out the required data:
Select a time frame that has little documents in a test environment first. Check how long it takes and that it ends correctly. After the relocation is done you get a list of technical ID’s migrated. When confident in a test environment, run in production environment, and monitor the storage of the content server (so it does not fill up to 100%).
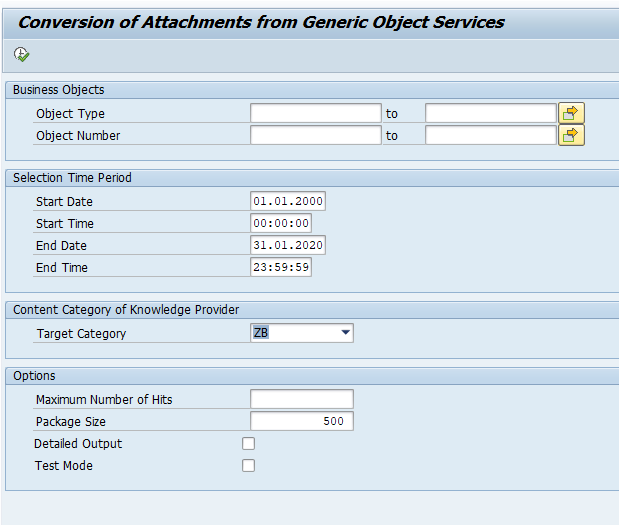
The program RSIRPIRL does not have many selection criteria. You might also find out that the time to migrate takes too long. If you need to migrate GOS document (global object services attachments), you can use program RSGOS_RELOCATE_ATTA:
This program migrates the GOS documents specified per type and page. GOS documents are normally the bulk of the documents. This way you can migrate most of the documents before running the full run with RSIRPIRL. Full background of program RSGOS_RELOCATE_ATTA can be found in OSS note 2293171 – RSGOS_RELOCATE_ATTA: Relocating attachments from generic object services.
The ABAP push channel (APC) is the ABAP implementation of websockets. It’s goal is to enable the ABAP stack to send push messages to registered web clients.
This blog will answer the following questions:
How to setup an ABAP push channel?
How to implement the ABAP push channel?
How to test the ABAP push channel?
Where to find more background and examples on ABAP push channel?
Setting up an ABAP push channel
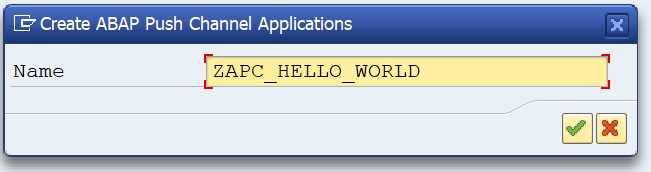
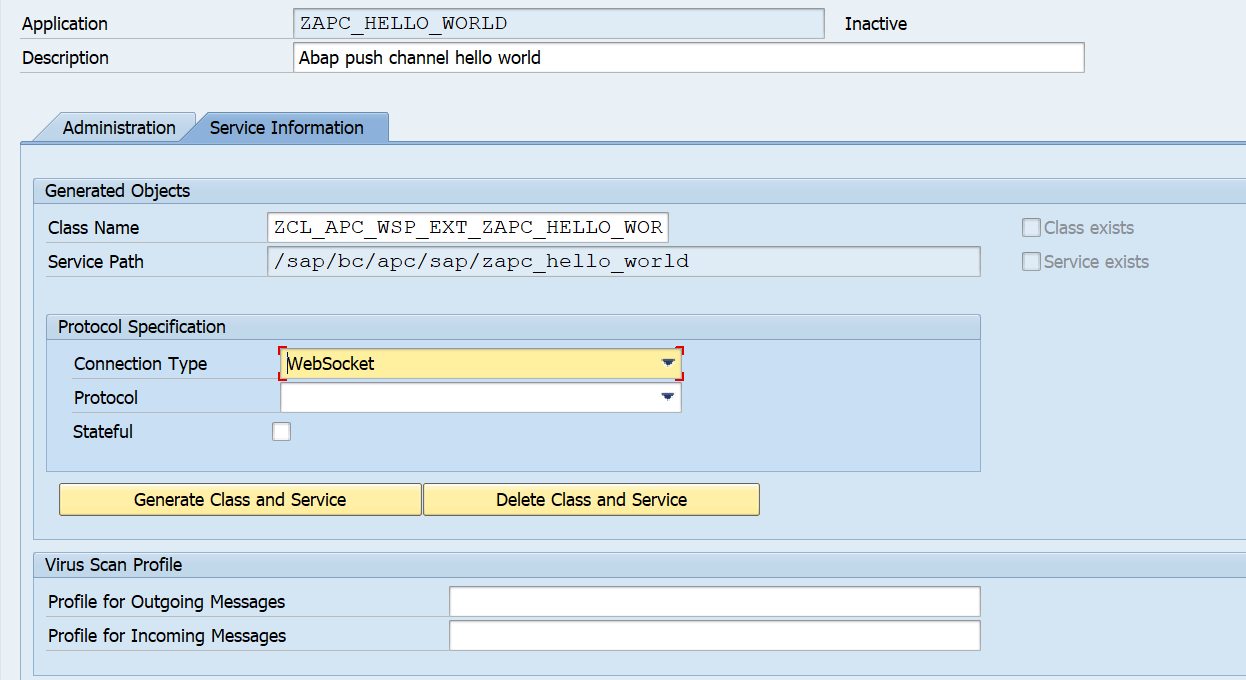
To setup an ABAP push channel go to transaction SE80 and right click, select create / connectivity / ABAP push channel notification.
Now press the Generate Class and Service button. The classes and services will now be generated as placeholders. Save your work.
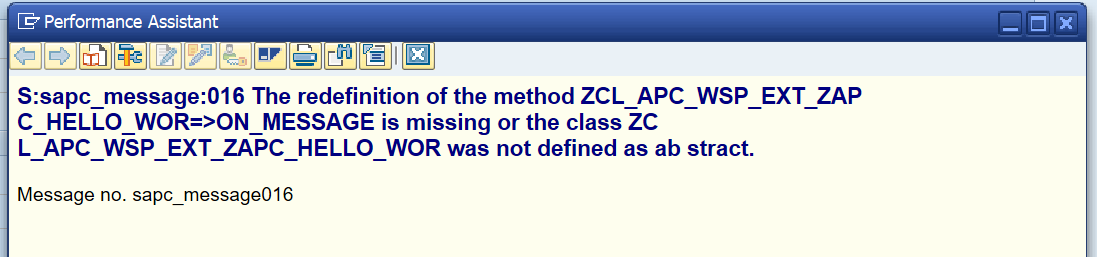
If you try to activate the service at this point in time you get this error message:
The reason is that we didn’t implement two methods of the new class yet: the ON_START and ON_MESSAGE.
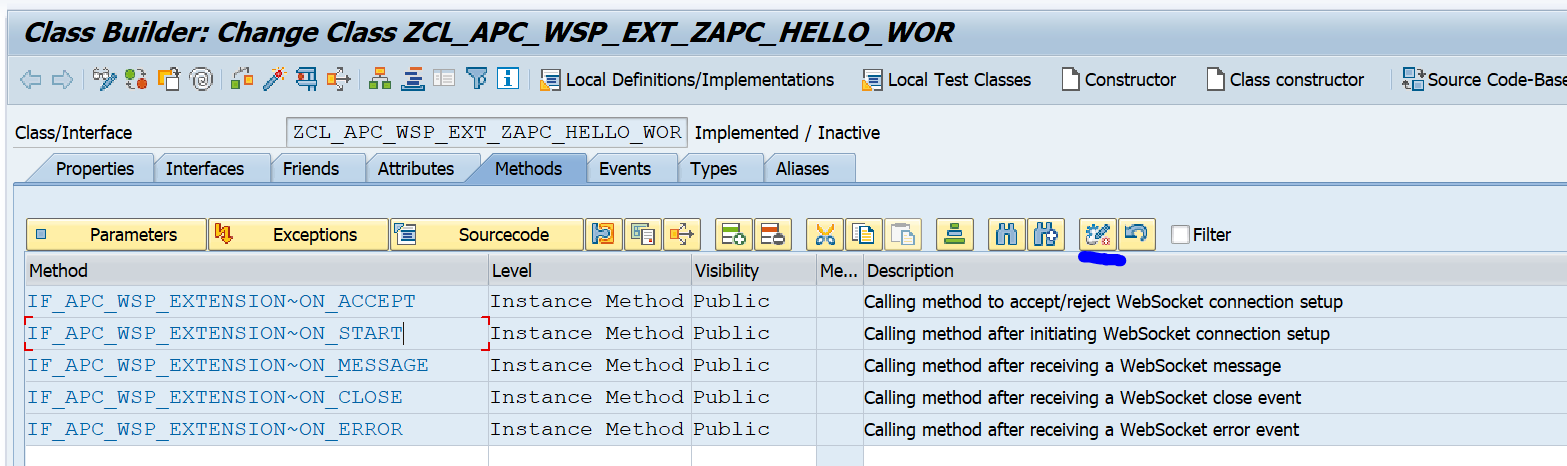
Implementing the actual APC class
To do this, we go to SE24 and lookup the generated class and we select the ON_START method:
Press the redefine button to redefine the method.
Use this code in the method:
TRY.
* send the message on WebSocket connection
DATA(lo_message) = i_message_manager->create_message( ).        lo_message->set_text( |ON_START has been successfully executed !| ).
i_message_manager->send( lo_message ).
CATCH cx_apc_error INTO DATA(lx_apc_error).
MESSAGE lx_apc_error->get_text( ) TYPE 'E'.
ENDTRY.
This basically confirms the push channel registration.
Now redefine the ON_MESSAGE method:
TRY.
* create the message object
DATA(lo_message) = i_message_manager->create_message( ).
* send message
lo_message->set_text( |Hello World !| ).
i_message_manager->send( lo_message ).
CATCH cx_apc_error INTO DATA(lx_apc_error).
MESSAGE lx_apc_error->get_text( ) TYPE 'E'.
ENDTRY.
It simply pushes the message: ‘Hello World’.
Save and generate the class in SE24.
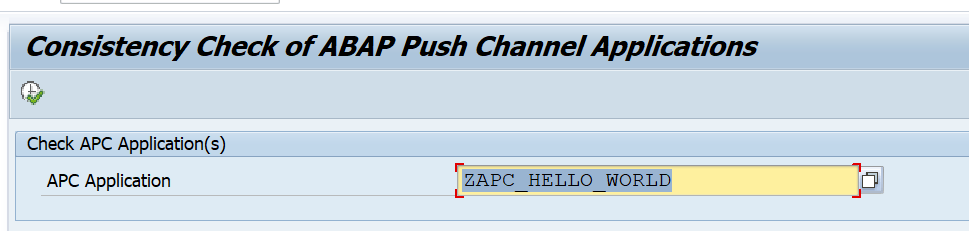
Now we can go back to the SE80 ABAP push channel we have created and activate it as well. You can run the consistency check to see all is fine:
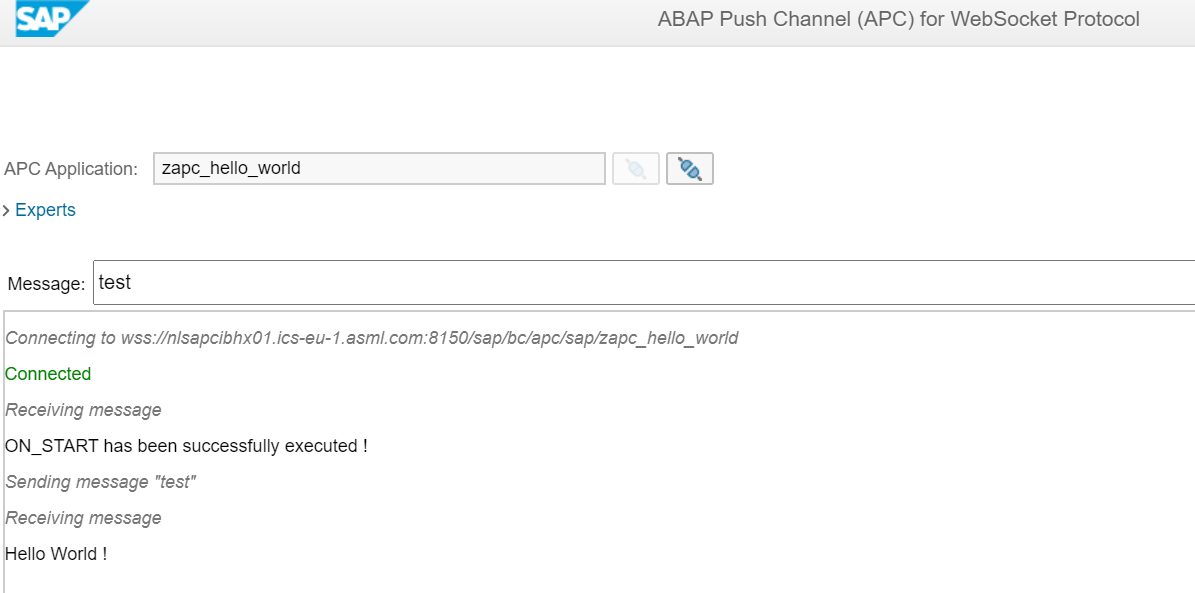
Testing the ABAP push channel
Now you can test the ABAP push channel by hitting the test button in the SE80 screen of the ABAP push channel. The test service will launch an ABAP webdynpro screen.
If the ABAP webdynpro screen does not launch, activate in SCIF transaction the following 2 nodes: WDR_TEST_APC and WDR_TEST_APC_WSP.
Test result:
As an alternative to SE80 you can also use transaction SAPC:
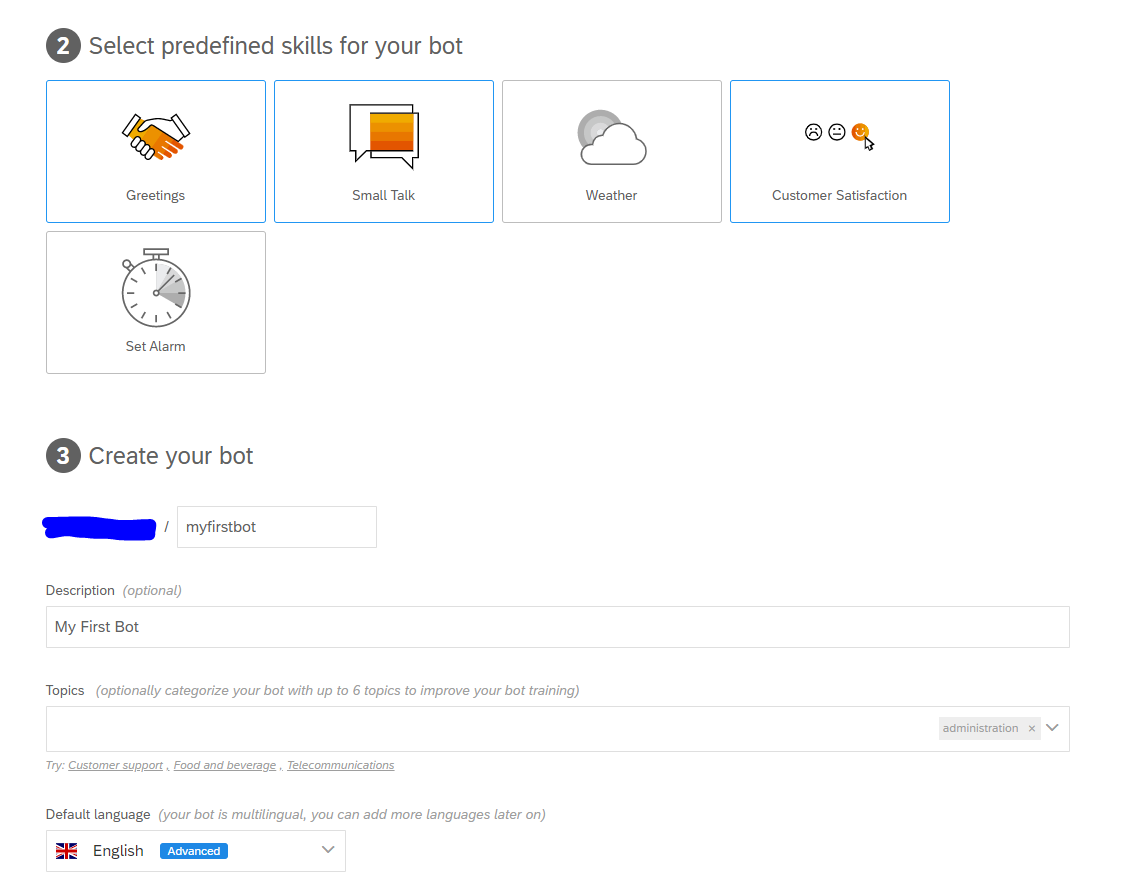
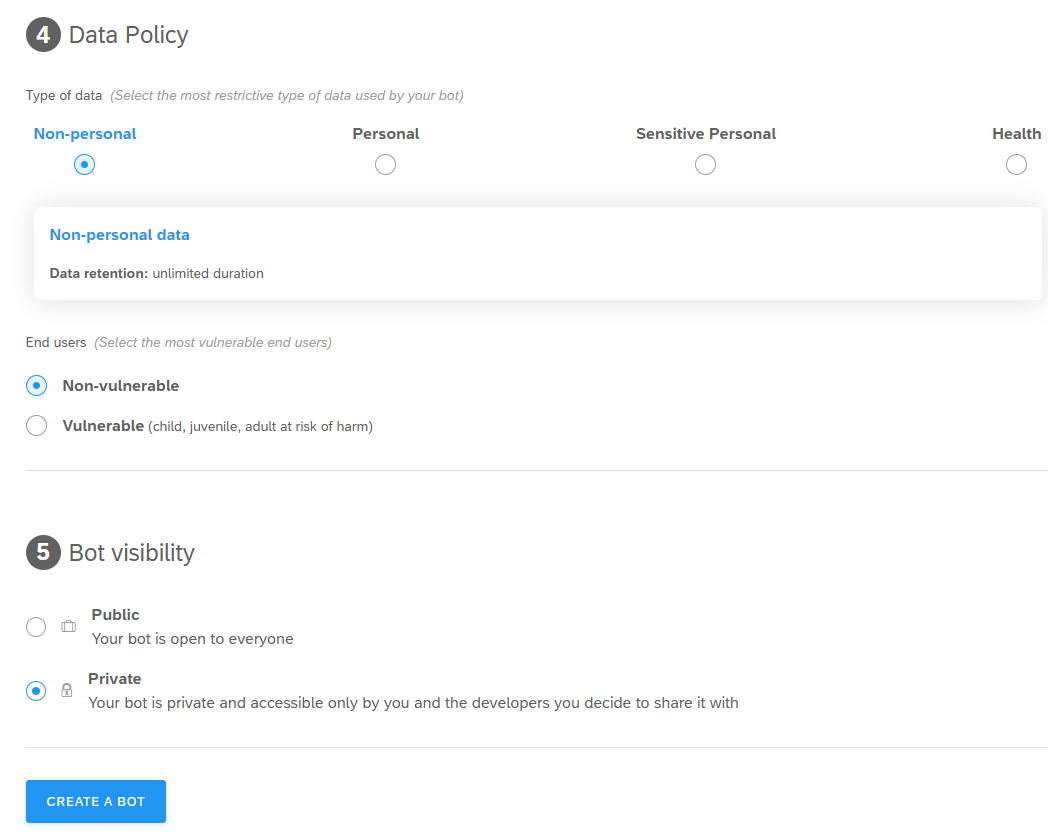
Here we choose Perform Actions and press the CREATE A BOT button:
Continue with the wizard:
Now create the bot.
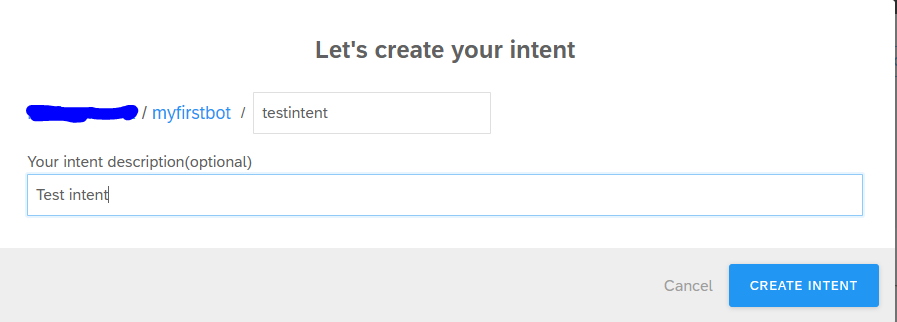
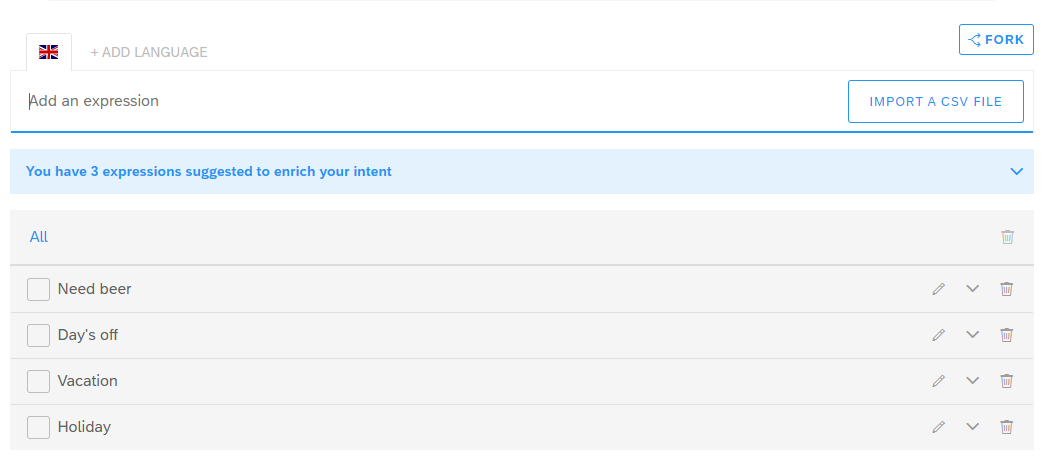
First thing to add is an intent:
And enter the detailed words (expressions) for the intent:
When the user keys in one of these words, it will trigger the bot.
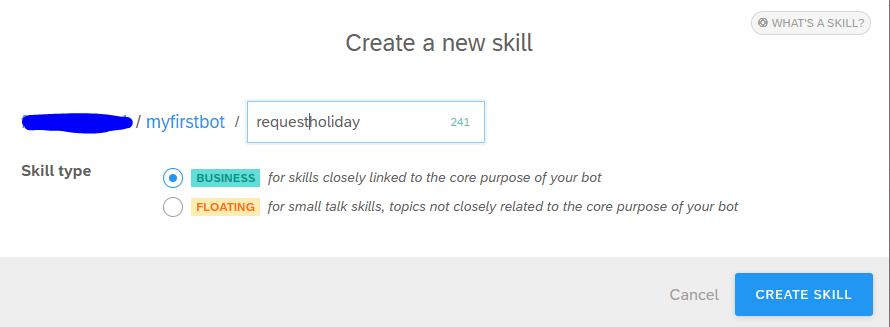
But this is only the trigger. There is no action yet. Goto the build tab and create a skill first:
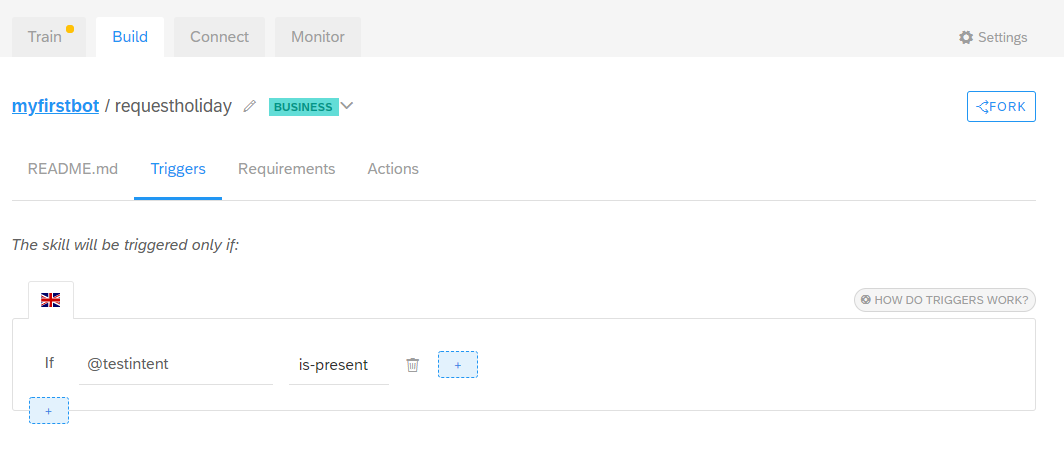
Now open the skill. In the skill you can goto the details to add a trigger:
Here we use our test intent we created before as trigger.
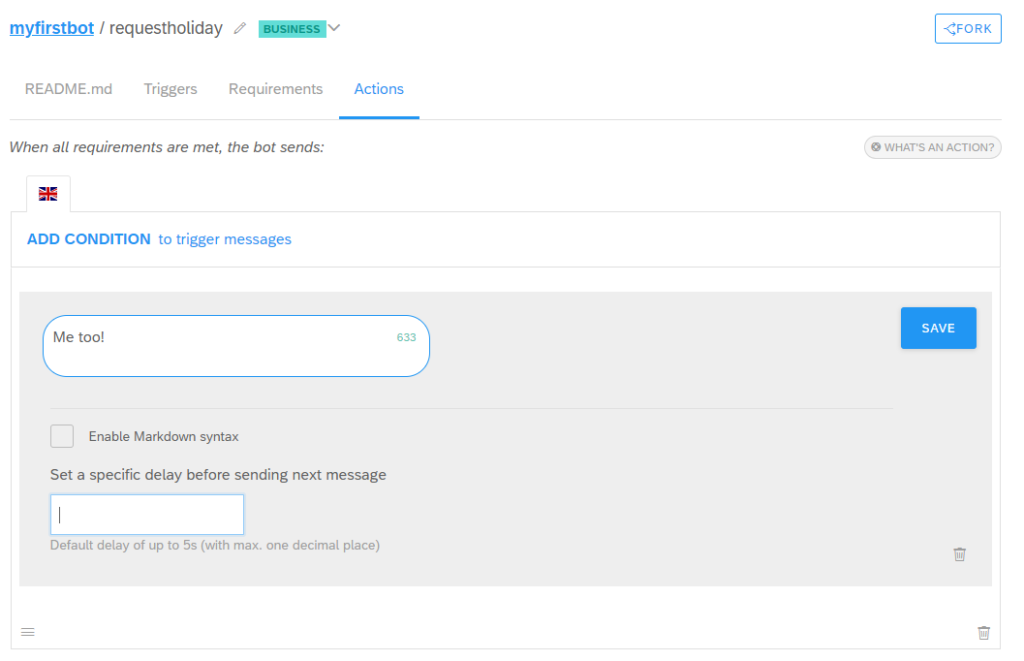
Now goto the Actions tab and create the wanted action:
In our simple case, we respond back with a text saying “Me too!”.
Testing the chat bot
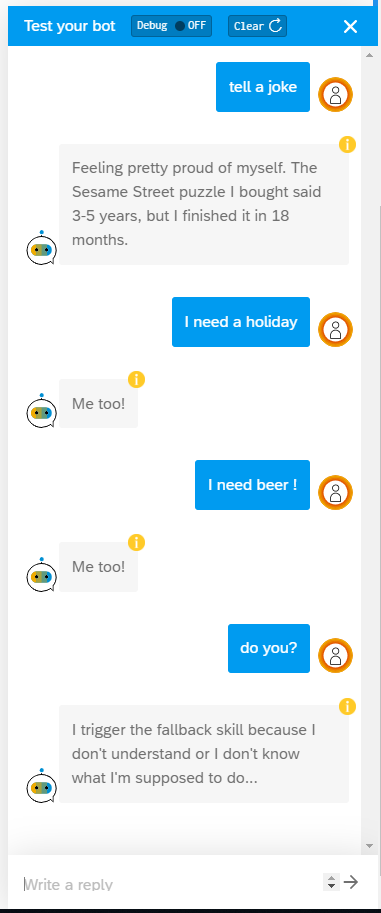
Now we will test our chat bot. Test result:
First thing we say is “tell a joke”. Then the bot will tell a joke.
Then we ask: I need a holiday. Since we have set the word “holiday” as an intent, the bot responds with the action and says “Me too!”. The same for I need beer. Any response question that is not in the chat bot script it goes to fallback.
OpenSAP course
SAP has a nice OpenSAP training on chatbot building. Follow this link.
When executing data archiving you have to be acting careful. The data archiving write and delete processes can be consuming a lot of CPU power from the database. Also, if you are not careful you might, by accident, claim all background processes. This blog will explain how to limit the amount of batch jobs used for data archiving. The data archiving run process itself is described in this blog.
Questions that will be answered in this blog are:
How can I limit the amount of deletion jobs?
How can I restrict the archiving jobs to run on a specific application server only?
Limit amount of deletion jobs
When the write run of data archiving is finished, this can have delivered many files. If you are not careful with the deletion, you select all files and each file will start a deletion run. This will consume a lot of CPU power on database level, since the deletion run will fire many DELETE statements to the database in rapid sequence. Also you might consume all batch jobs, leaving no room for any business batch job.
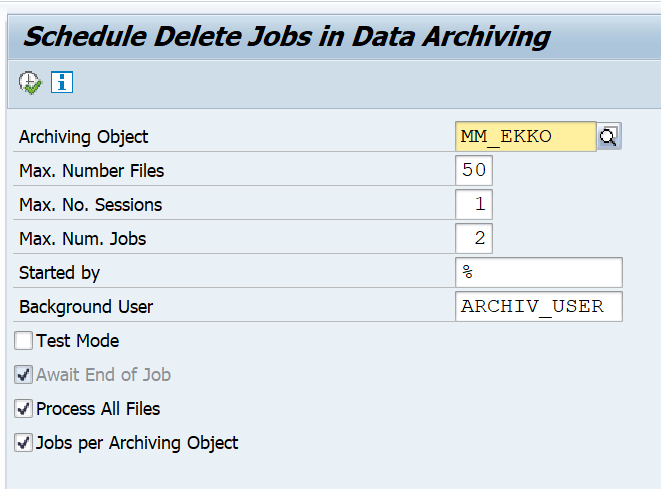
In stead of running the deletion from SARA, you can also run the deletion via program RSARCHD:
With this example, MM_EKKO files will be deleted. Maximum of 50 files from 1 archiving run will be processed, with a maximum of 2 deletion batch jobs running at the same time.
General application server restrictions via batch job server group
In SM61 you can setup a special batch job server group. Here can assign a single application server for you data archiving batch job processing. We assume here you created a group called DATA_ARCH.
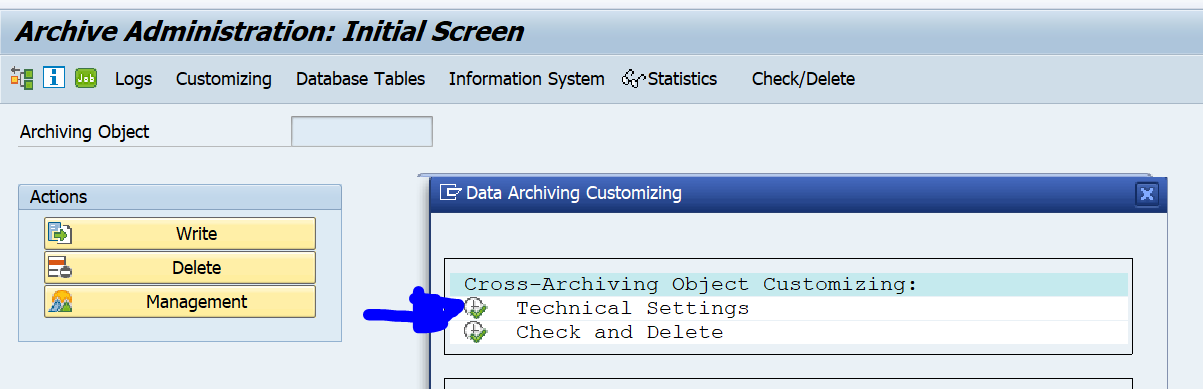
In SARA you can now goto the general data archiving settings:
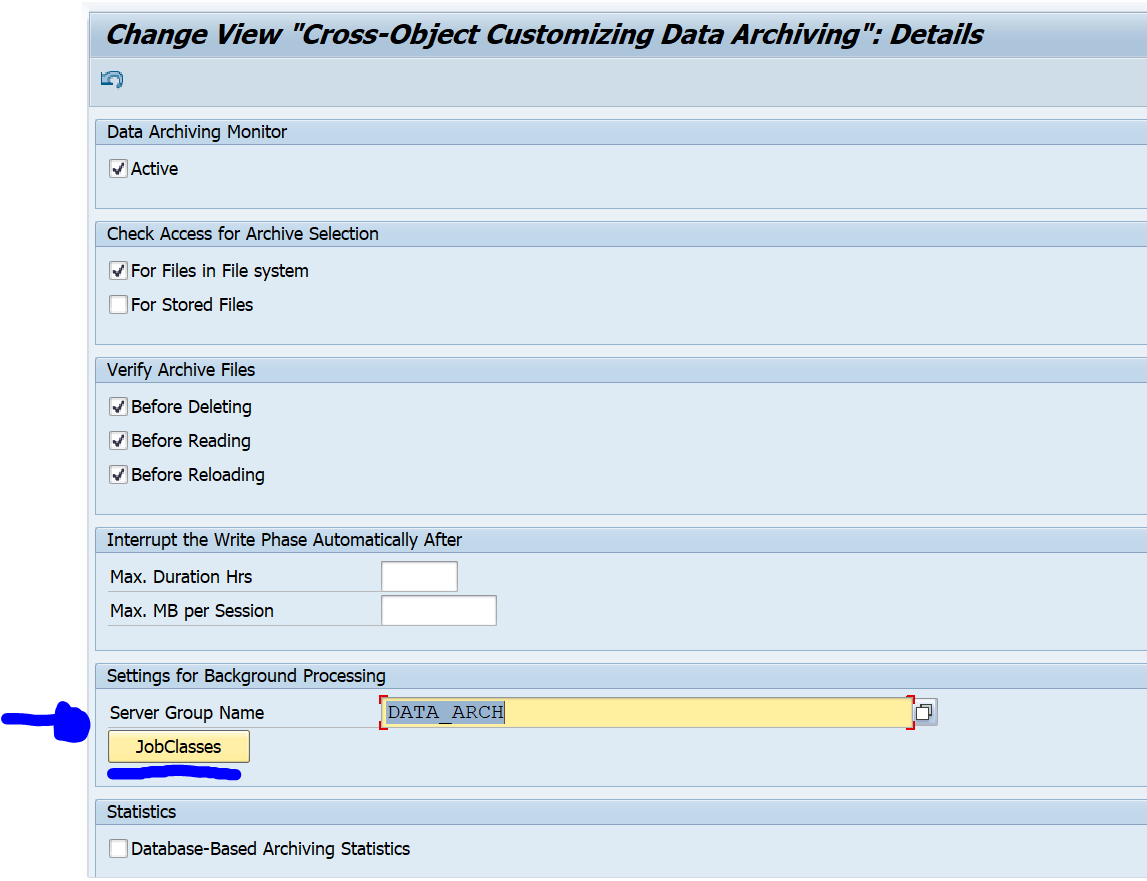
Now you can link the batch job server group:
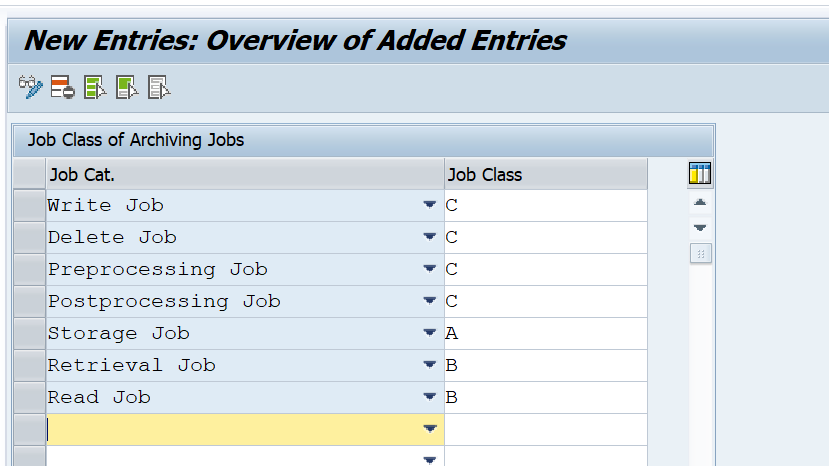
With the button JobClasses you can specify the job priorities per data archiving function:
A = high priority, C = low priority. The above screen shot is an example.
The SAP ABAP stack can also interface using REST protocol. To support this interface protocol SAP has developed special classes in the ABAP stack.
Questions that will be answered in this blog are:
How do I create a REST interface in ABAP stack?
How do I test a REST interface in ABAP stack?
Which tools to use to developer REST interface?
REST in ABAP
SAP delivers in the ABAP netweaver stack the ABAP REST library. The full specification can be found on the SAP help portal. The help portal also contains a small tutorial. Next to the pre-delivered REST library classes there are no tools for you available to faster develop REST in ABAP. It is coming down to SE24 and SE80.
We will create a simple Hello World REST service in ABAP. There are 2 main classes in REST ABAP: the application class handling the URL and the resource class where the logic is.
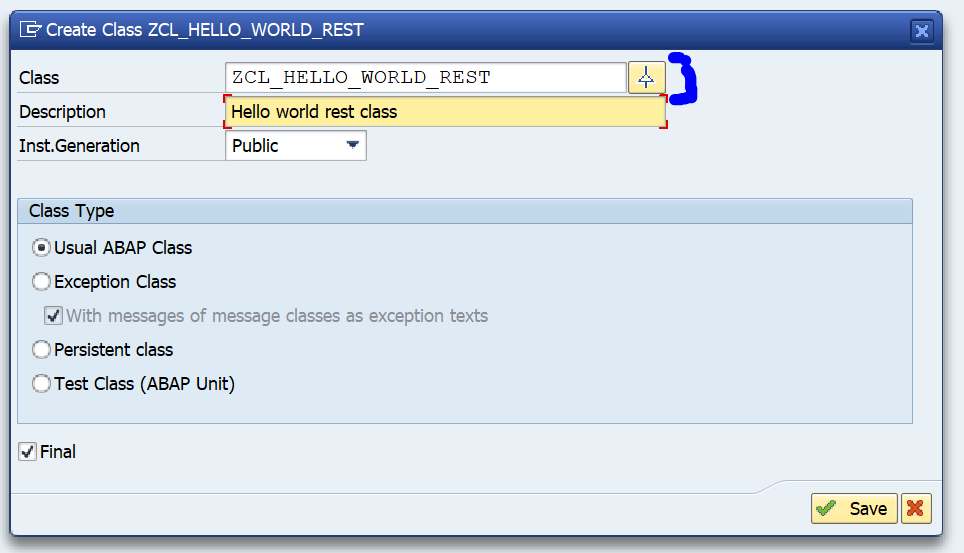
Start transaction SE24 and create a new class inheriting from the SAP delivered class CL_REST_HTTP_HANDLER:
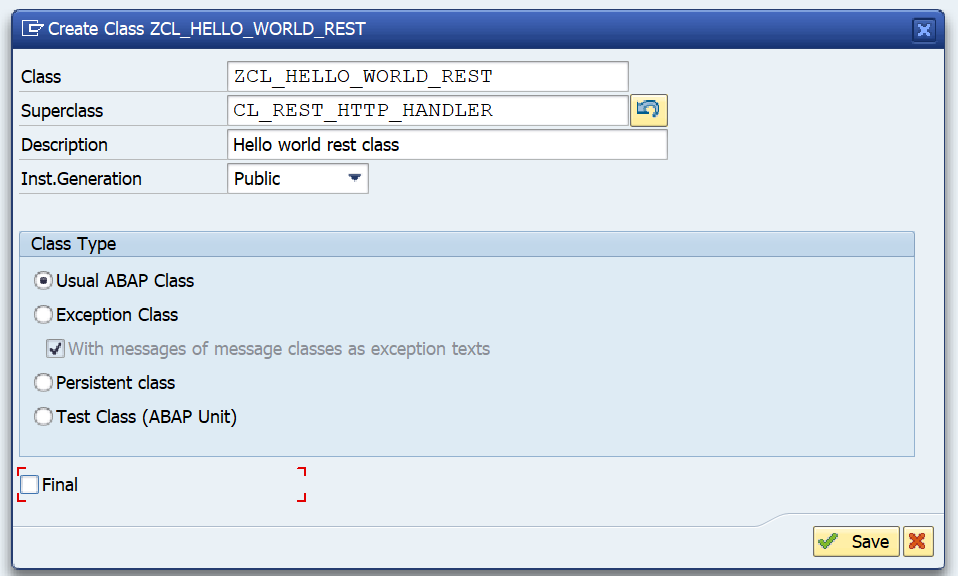
important here to press the inheritance button! Fill out CL_REST_HTTP_HANDLER as superclass:
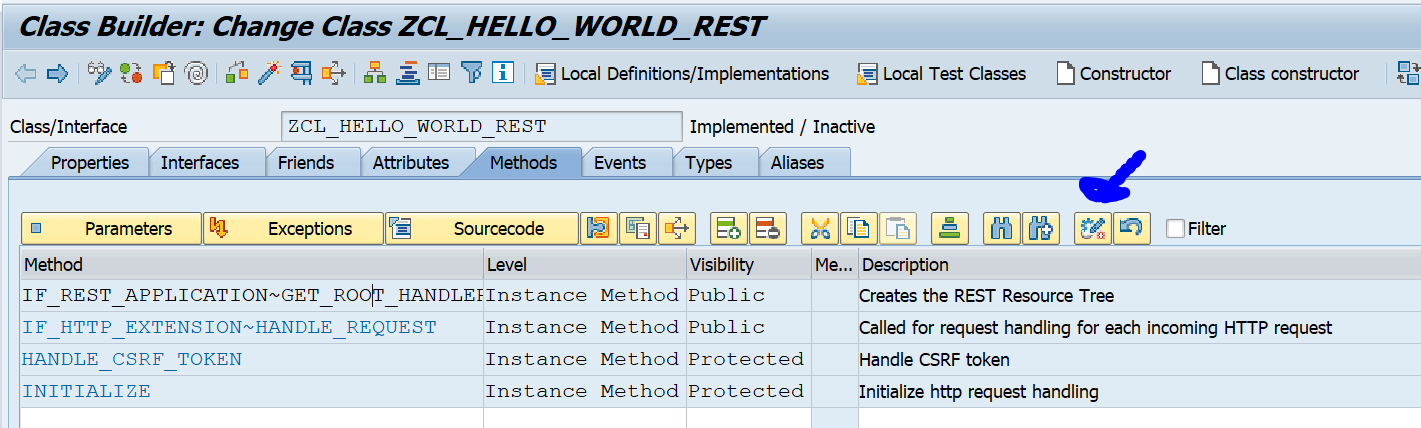
It is mandatory to redefine the GET_ROOT_HANDLER method:
For now just leave the method empty. Save and generate.
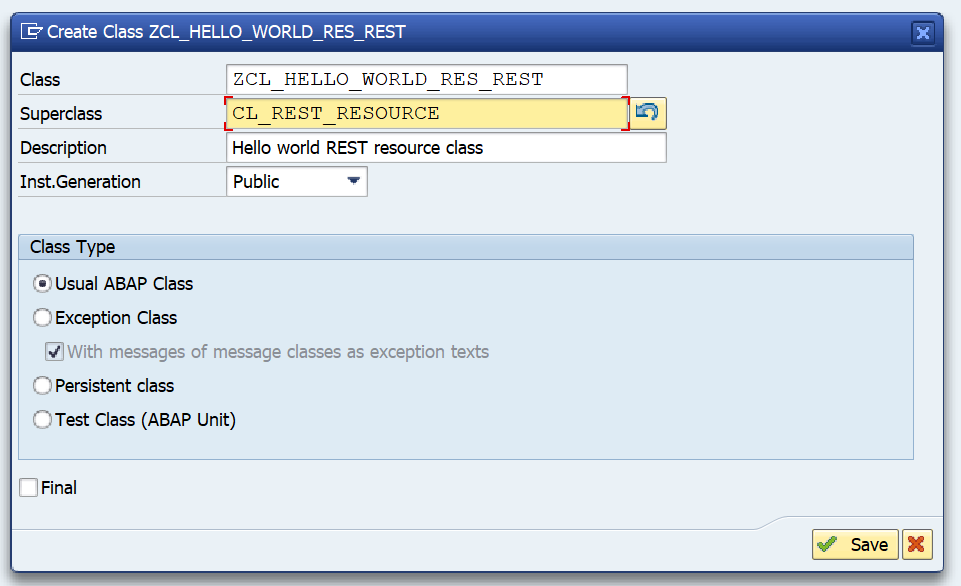
Now create the REST resource class based on inheritance of CL_REST_RESOURCE:
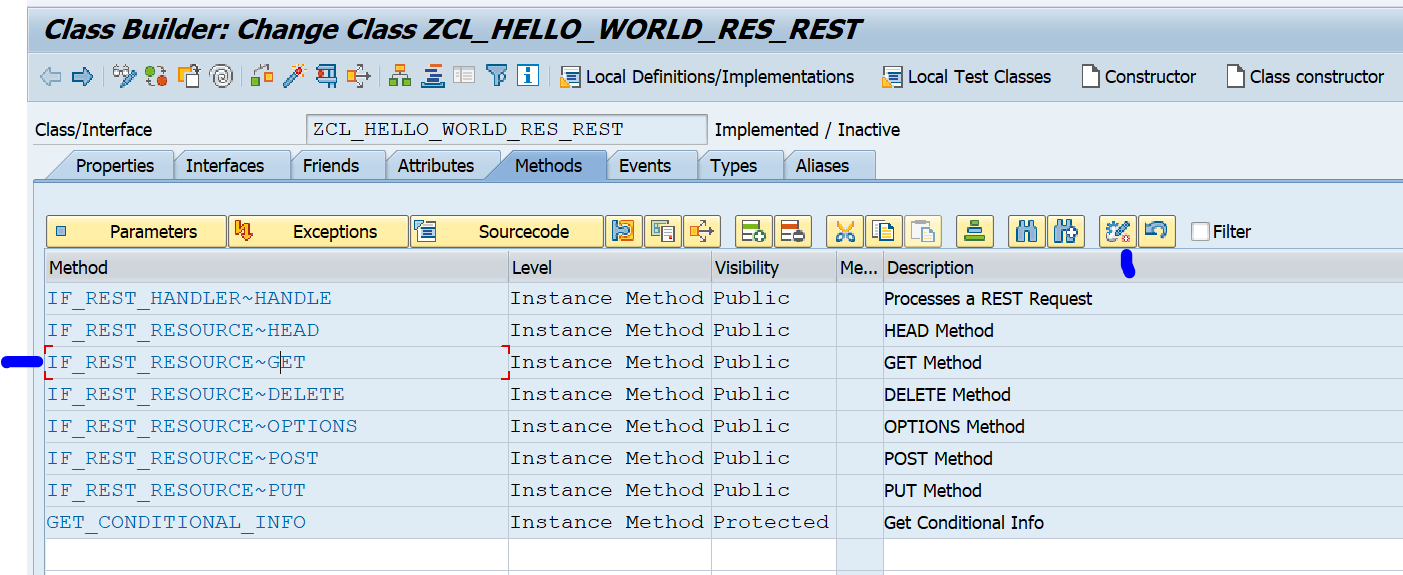
Now redefine the GET method:
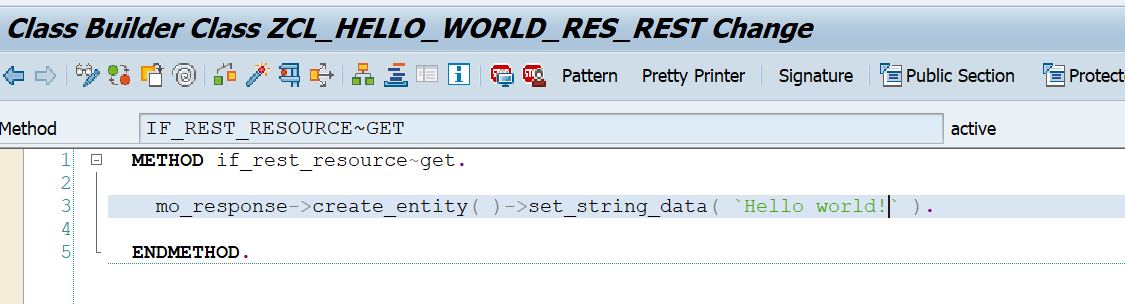
No we add a simple implementation by simply adding the text ‘Hello World’:
Save and activate this class.
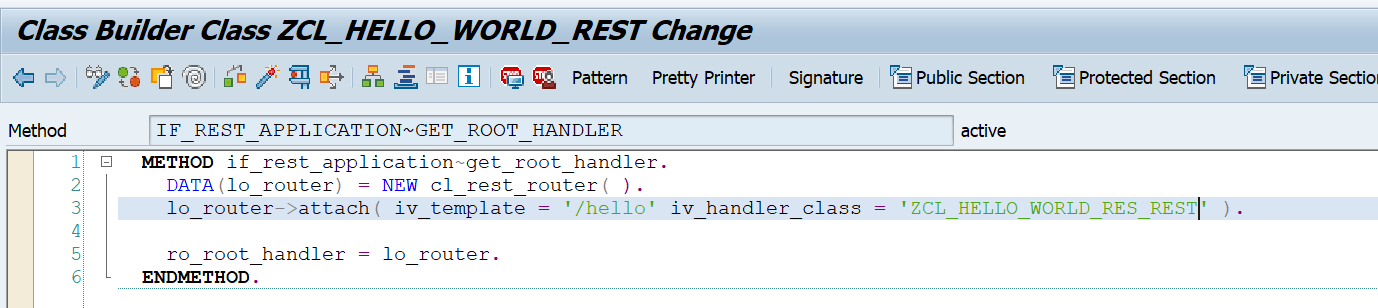
Now we go back to the previous class: the application class. In here we now edit the GET_ROOT_HANDLER implementation we left empty earlier:
If the URL is getting the input /hello then the handler class (our resource class) ZCL_HELLO_WORLD_RES_REST is called. This class will return the string.
Save and activate again. The coding work is done.
Runtime implementation
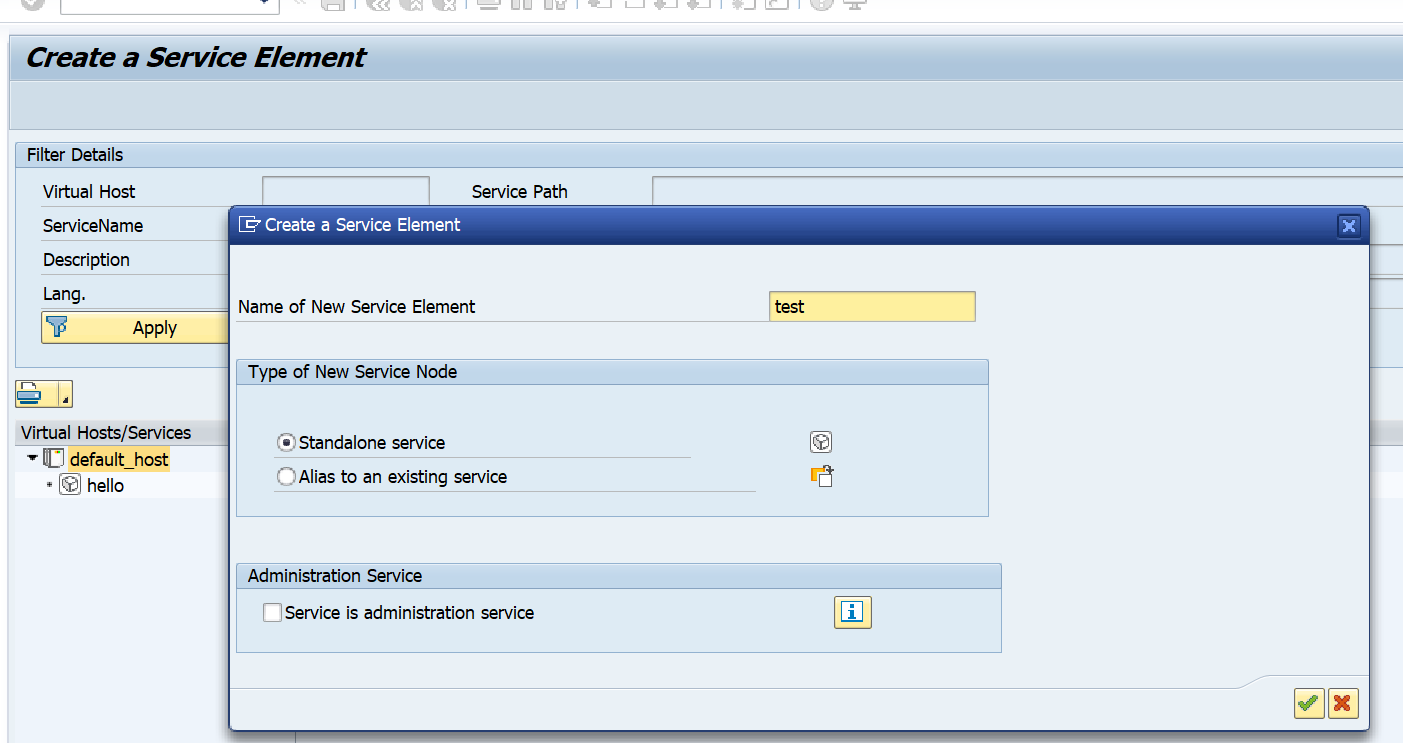
Now we need to make a runtime implementation. Goto transaction SICF and select the main node default_host first. Then select from the menu Service/Host the option Create Service:
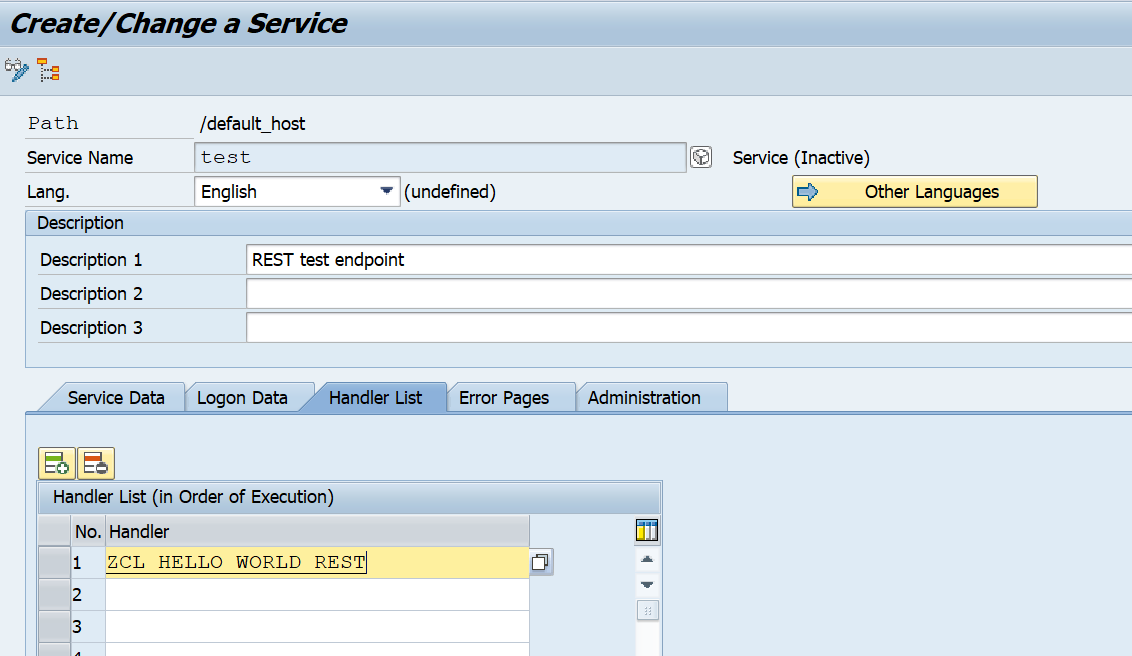
Fill out the name of the service and click ok. In the next screen give a description and in the Handler List section refer to the application class ZCL_HELLO_WORLD_REST:
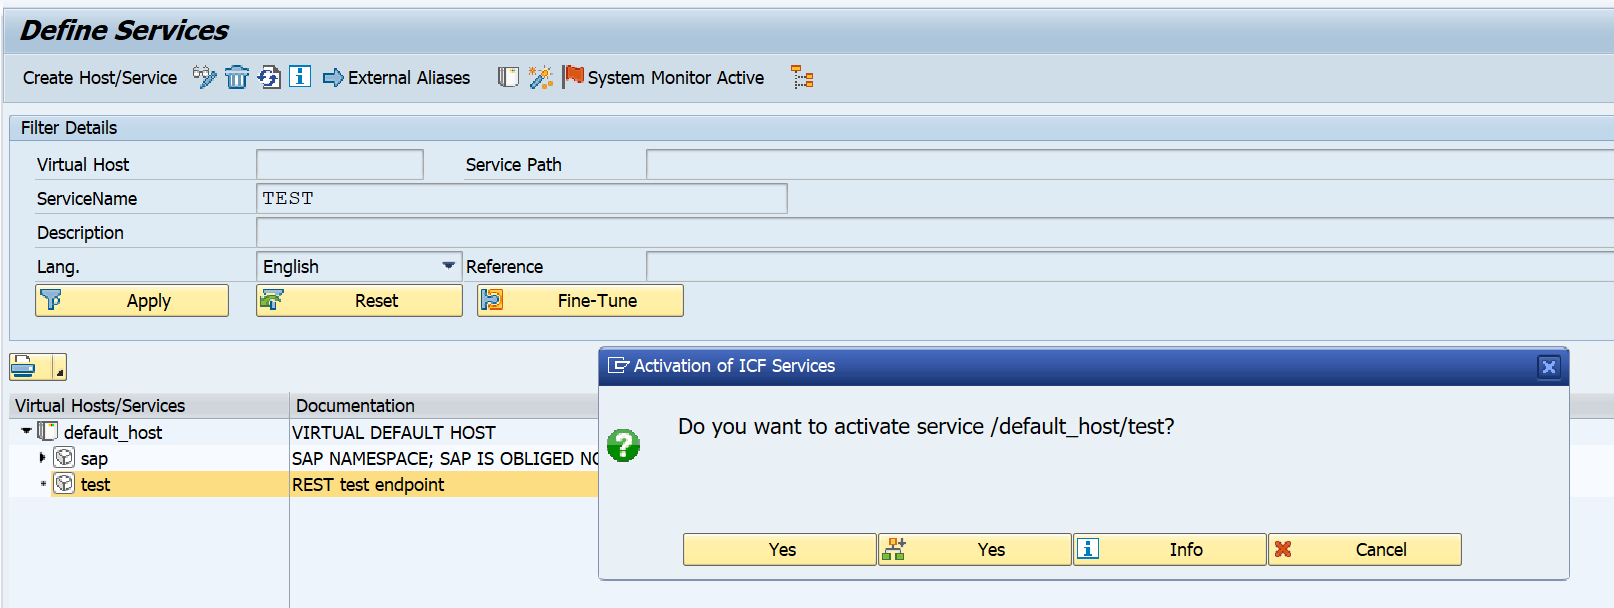
Save the service. The service is created but not active. To activate right click on the service and select Activate:
Testing the service
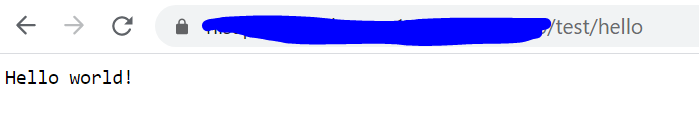
From the previous SICF screen right click the service again and select the option Test Service. A screen will come that says “No suitable resource found”. Now modify the URL by adding /hello after the test in the URL, and press enter again:
The URL build up: the test is the name defined in SICF. The /hello was defined in the application class.
Authorizations and security
The REST library has no specifics about authorization and security. So you have to take care your self.
Business authorization security: has to be built in via AUTHORITY-CHECK statements at the correct spots.
Technical security is provided in the Logon Data tab on the SICF node. Here you can set requirements for the technical logon method and if you only allow https.
REST versus ODATA
ODATA is based on REST and has more features. If you have a choice, you best use ODATA. ODATA exposing is described in this blog.
In SAP REST is supported, but you have to code a lot, and limited tools are available. For ODATA much more development and monitoring tools are available.
In the previous blog we have setup RFC enabled function module. If you want to expose this function module as ODATA service you can use the wizard in transaction SEGW. This blog assumes the basis ODATA basis activation has been performed (see this blog).
Questions that will be answered in this blog are:
How do I generate an ODATA service based on a RFC function module?
How do I test if the ODATA service is properly working?
Set up of the ODATA service
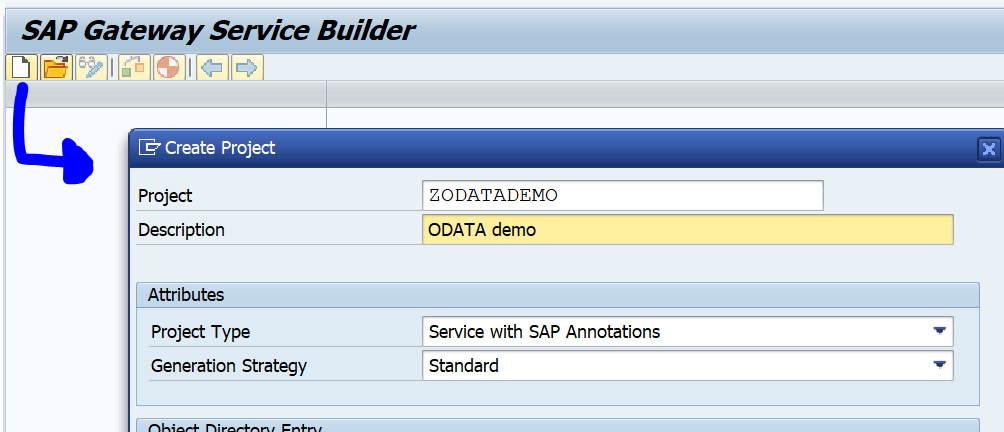
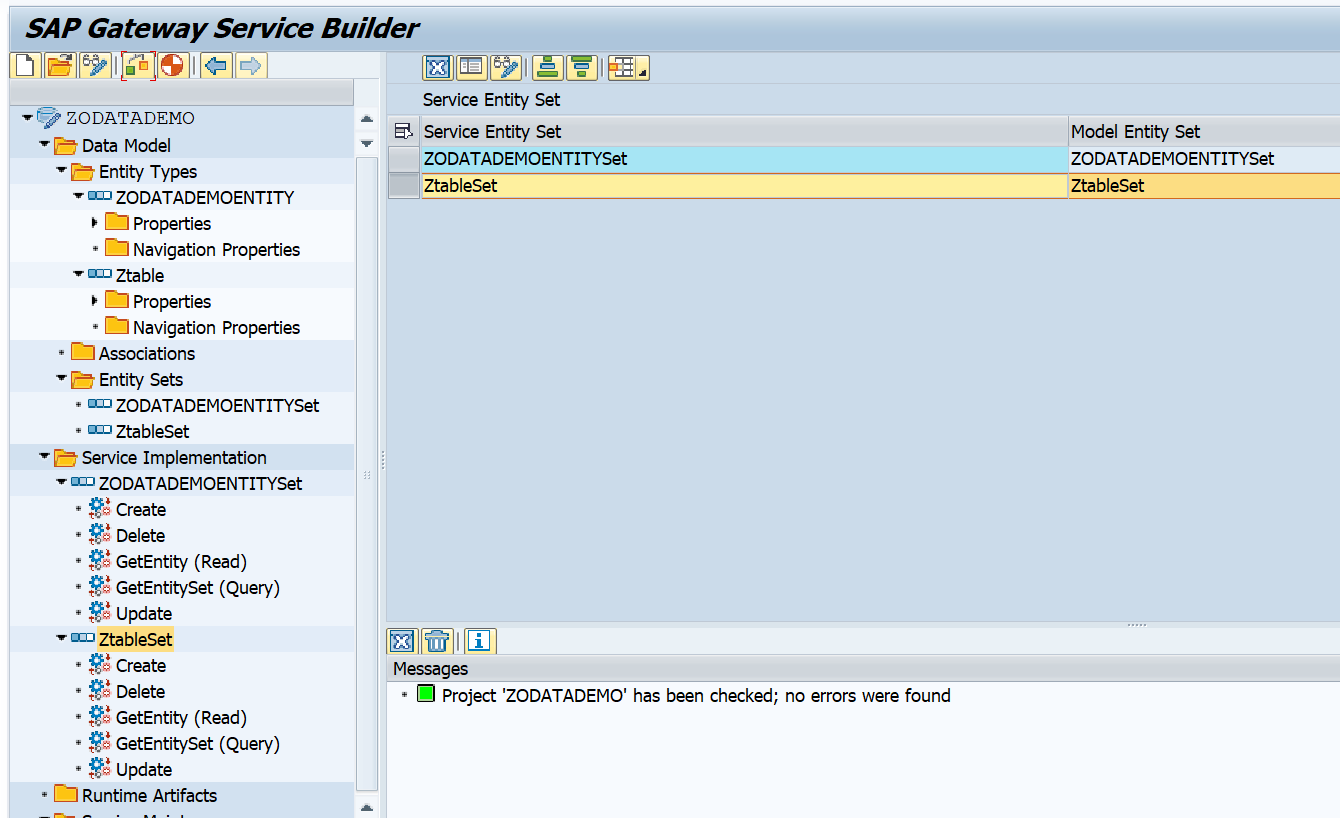
Start transaction SEGW and create a new project:
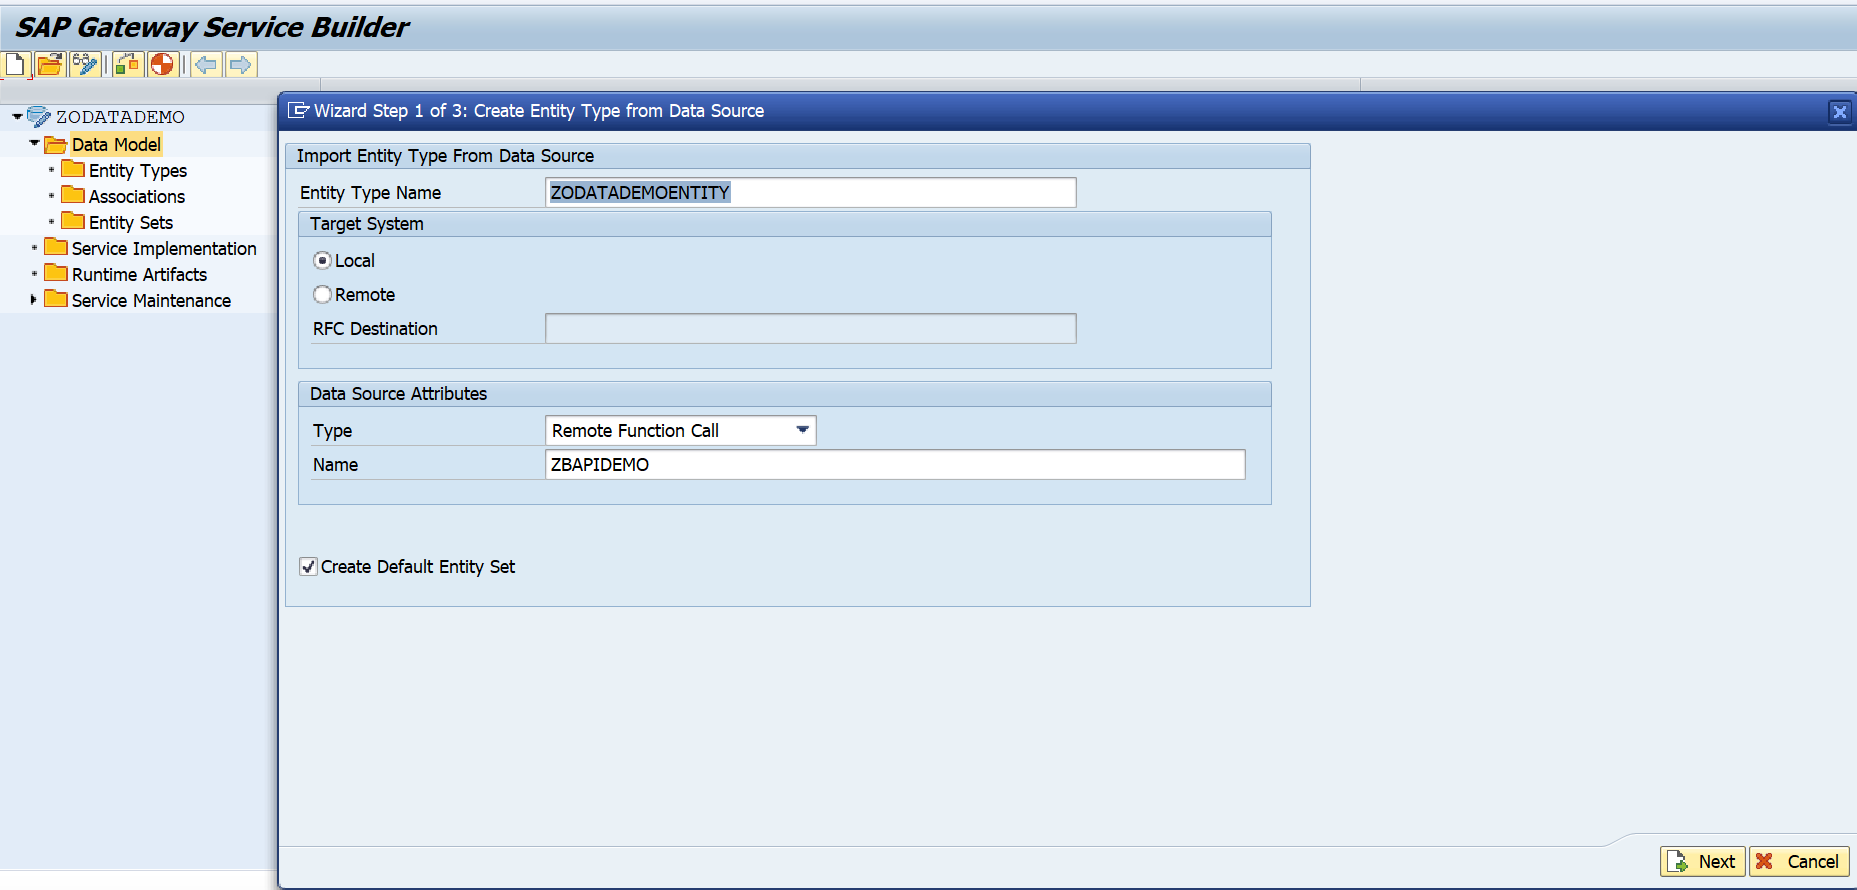
Now start the RFC import wizard by right clicking on Data Model and selecting the option Import and then RFC/BOR interface:
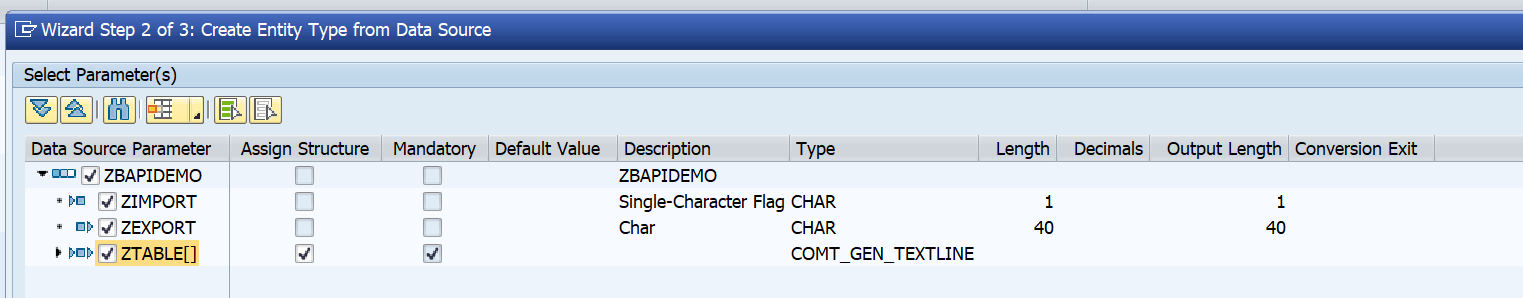
Now select the data parameters:
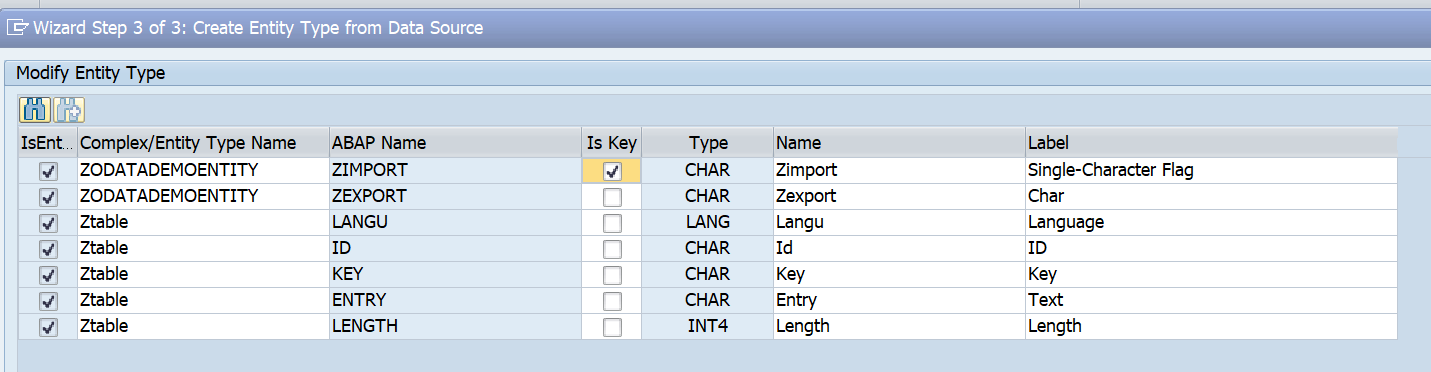
And enter which field is key field:
After pressing finish the wizard will generate the needed classes.
Save your work and press the check button to validate if everything is ok:
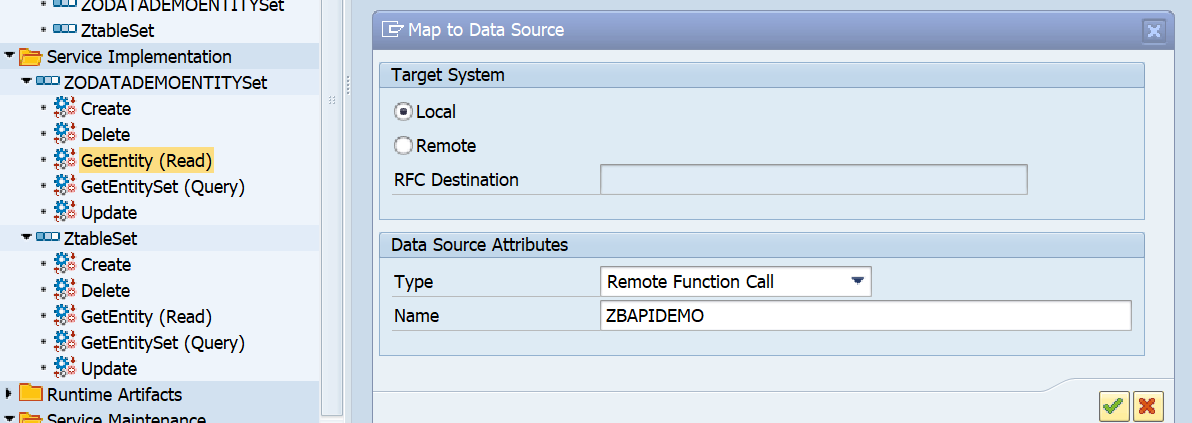
Now we need to map the implementation to the RFC module. Right click on the GetEntitySet below ZODATADEMOENTITYSet and select Map to Data Source:
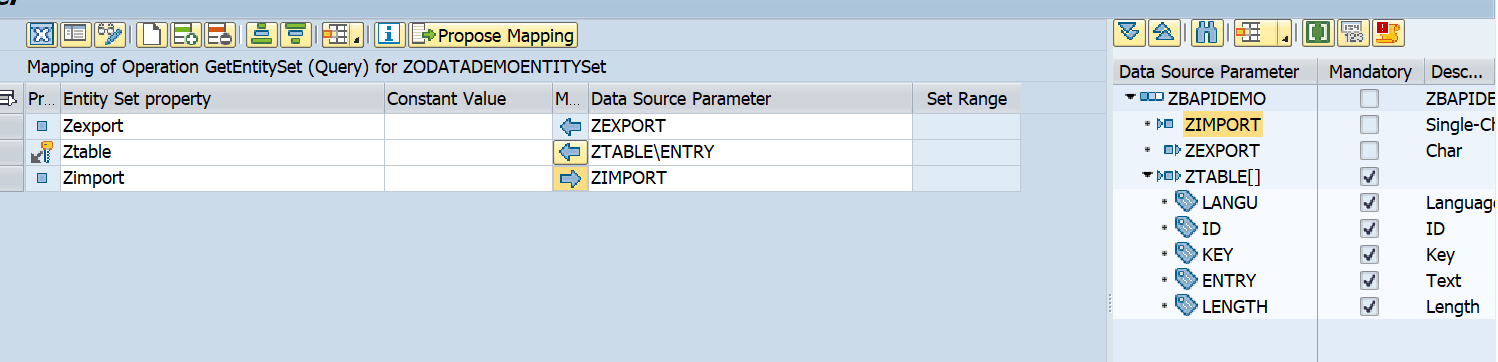
Now map the fields (you can use drag and drop):
Now you need to map the data fields correctly and press check.
Save your work.
Generation of objects
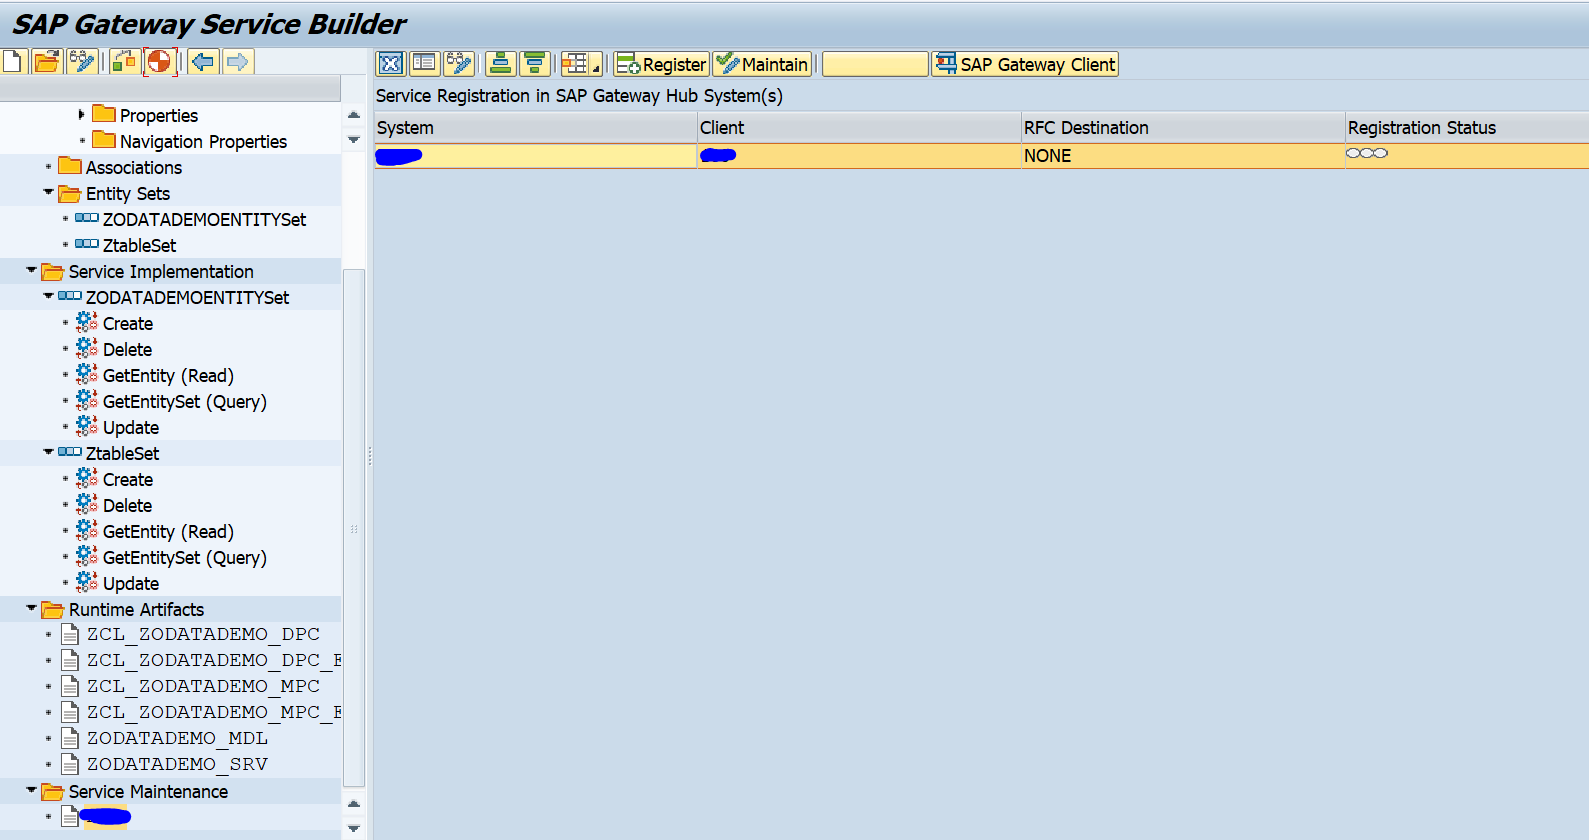
You can see that the Runtime Artifacts section is still empty.
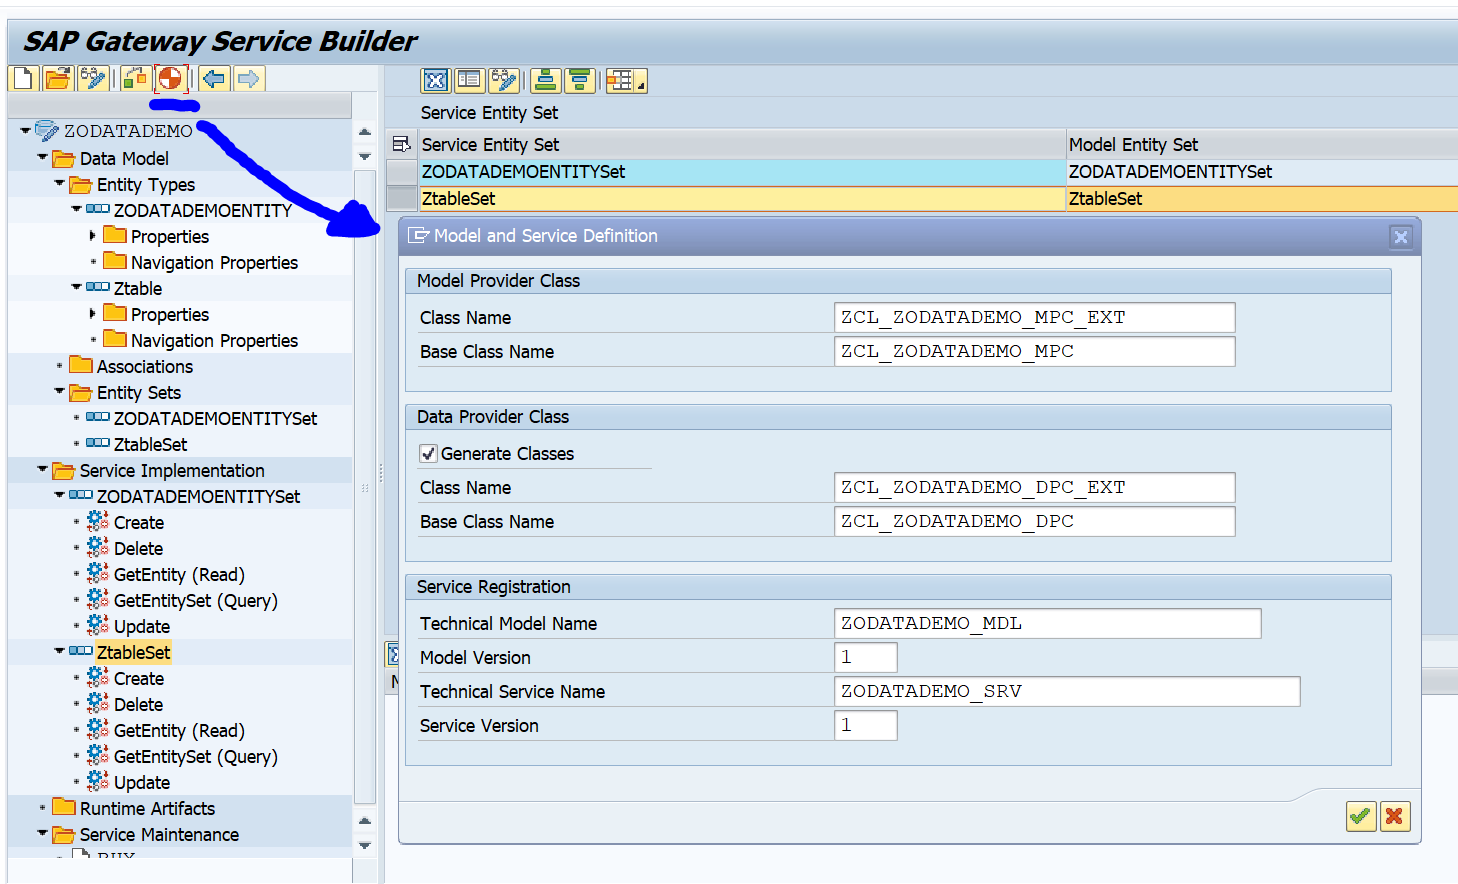
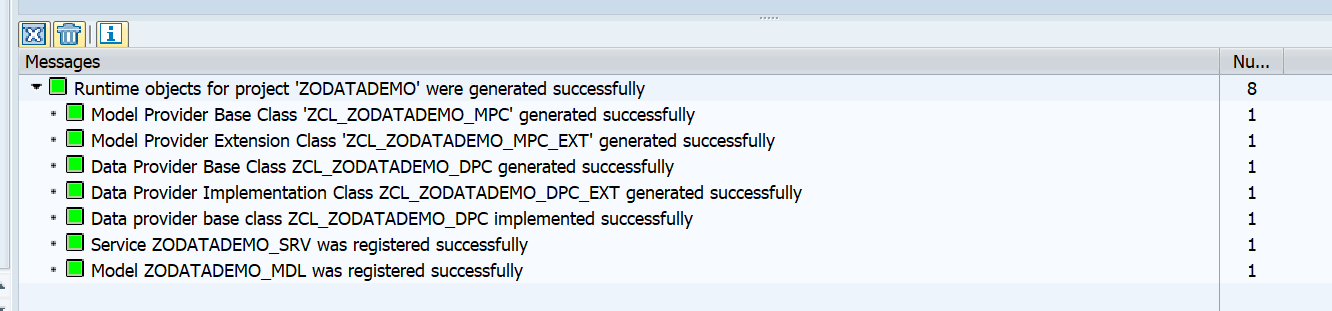
Now press the button Generate Runtime Artifacts:
Wait for the generation to finish:
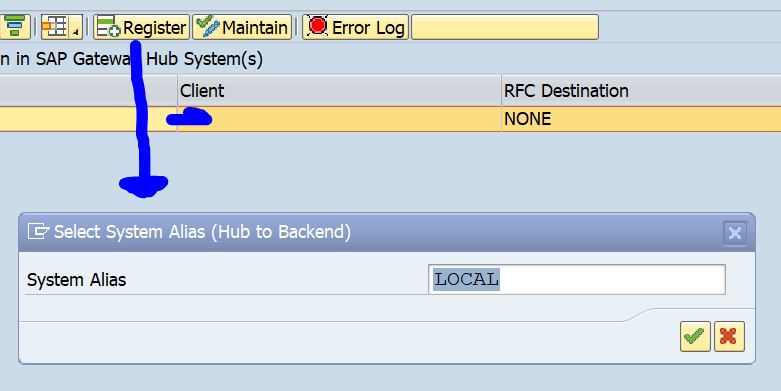
Now the runtime artifacts are generated, but the service maintenance is not done yet. Open the section Service maintenance and double click on the system:
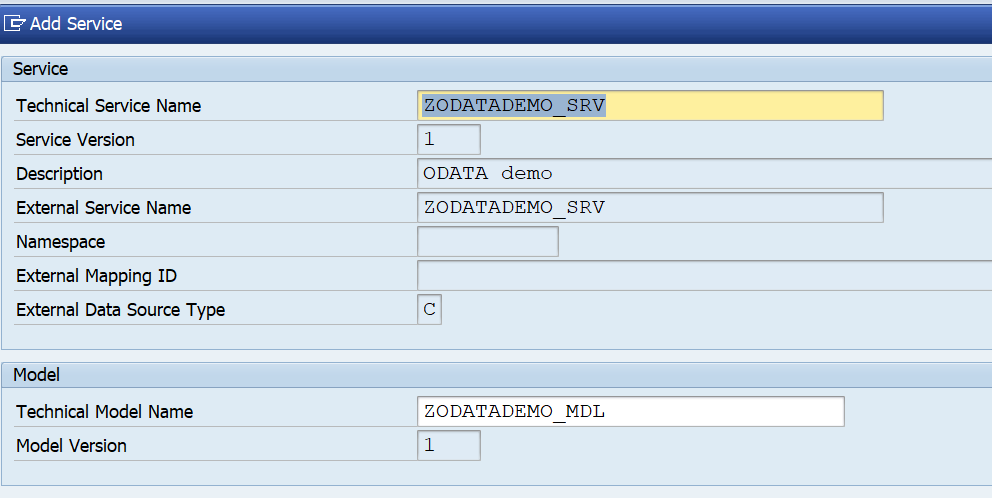
Now press the Register Service button:
Accept settings and assign package for transport:
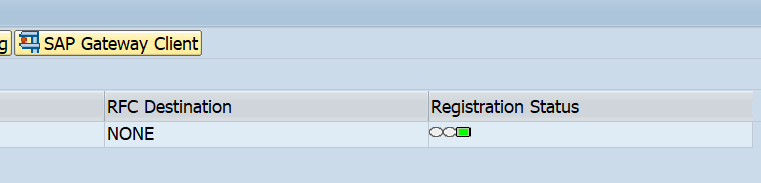
Now the registration status is green.
Testing the ODATA service
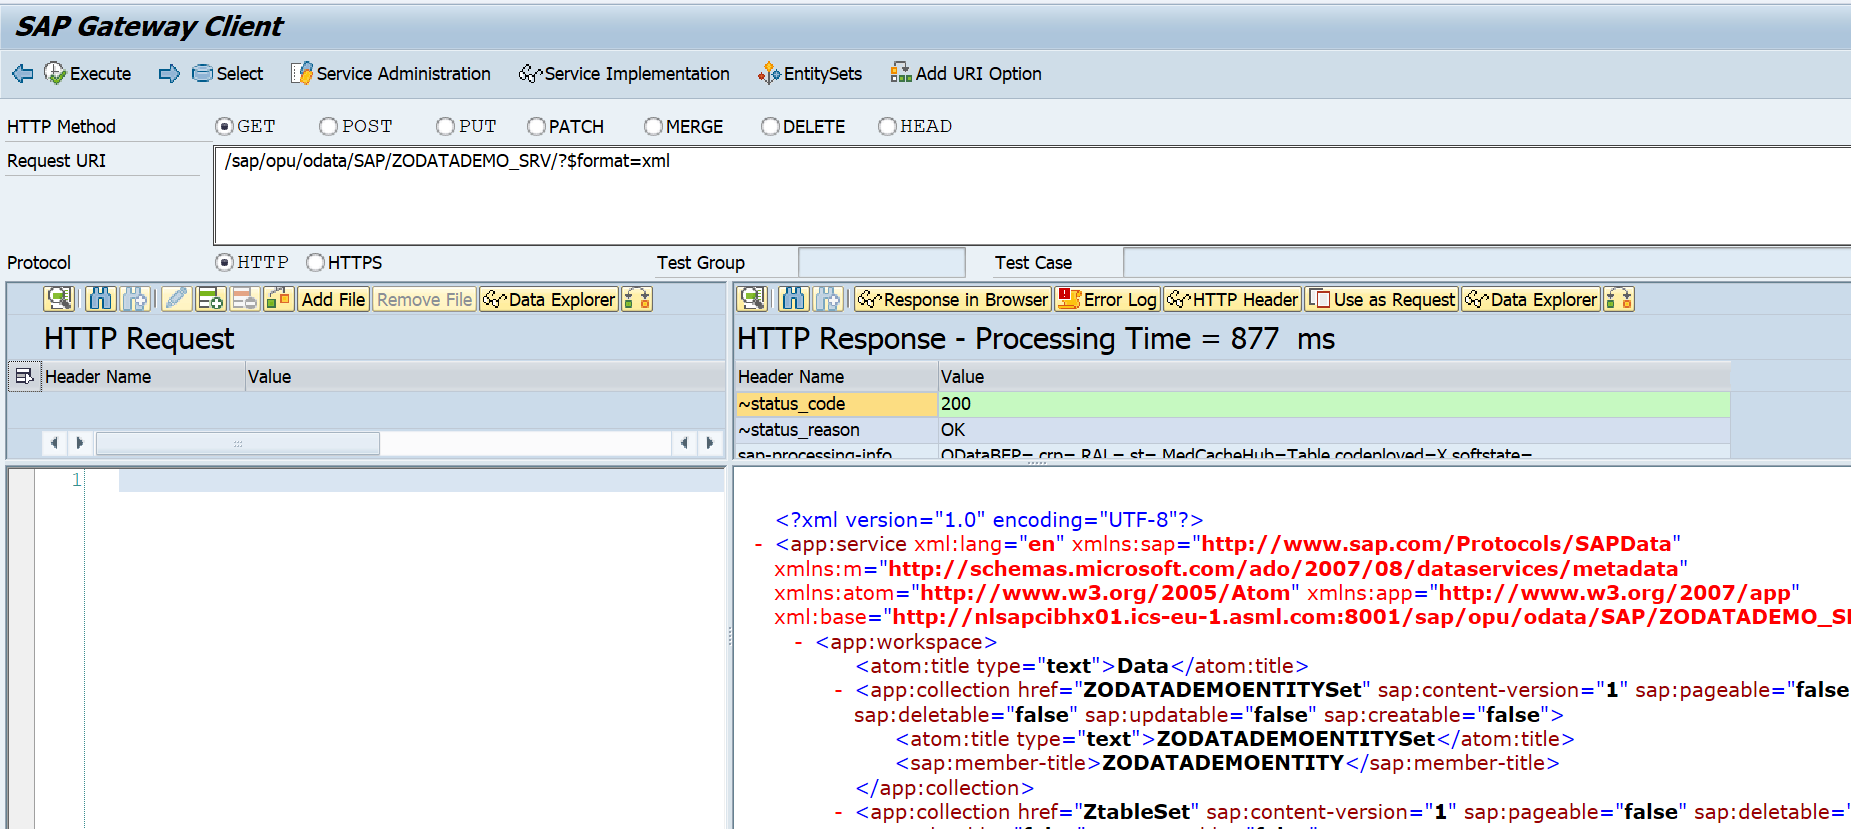
Press the button SAP Gateway Client (or start transaction /IWFND/GW_CLIENT directly, and then enter the correct service):
The test client starts:
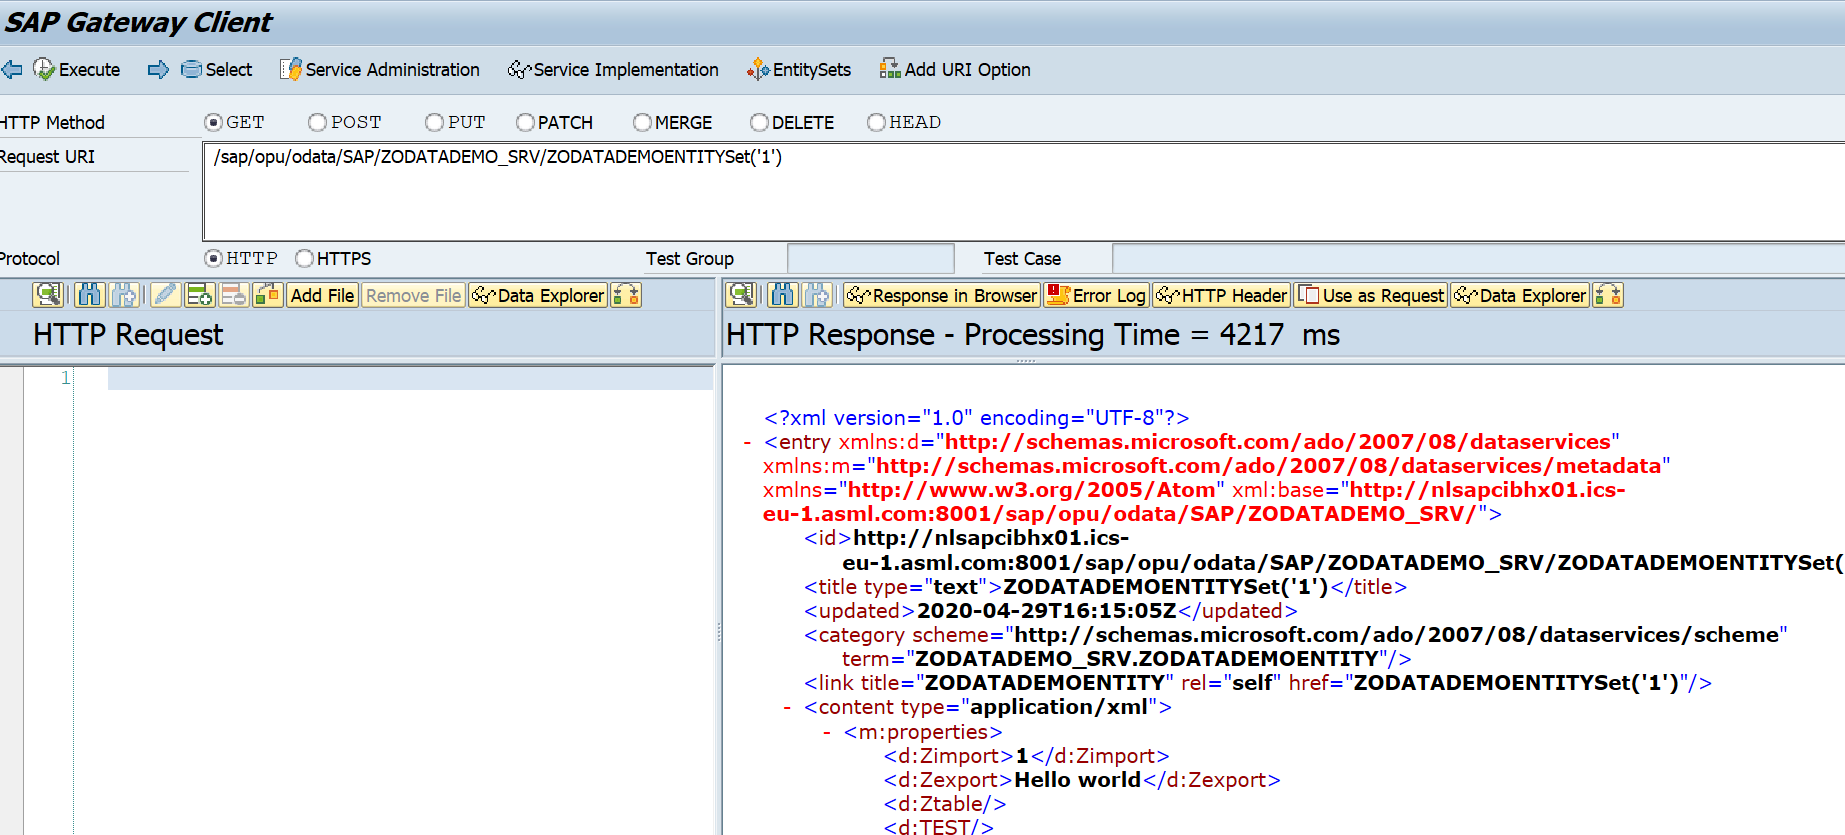
Enter the correct inputdata: /sap/opu/odata/SAP/ZODATADEMO_SRV/ZODATADEMOENTITYSet(‘1’)
And check the output:
Attention points
The example above seems simple, but you will face more issues in real live implementation when you need to add tables and more complex structures. In those cases additional configuration and many times extra coding in the methods of the generated classes is required.
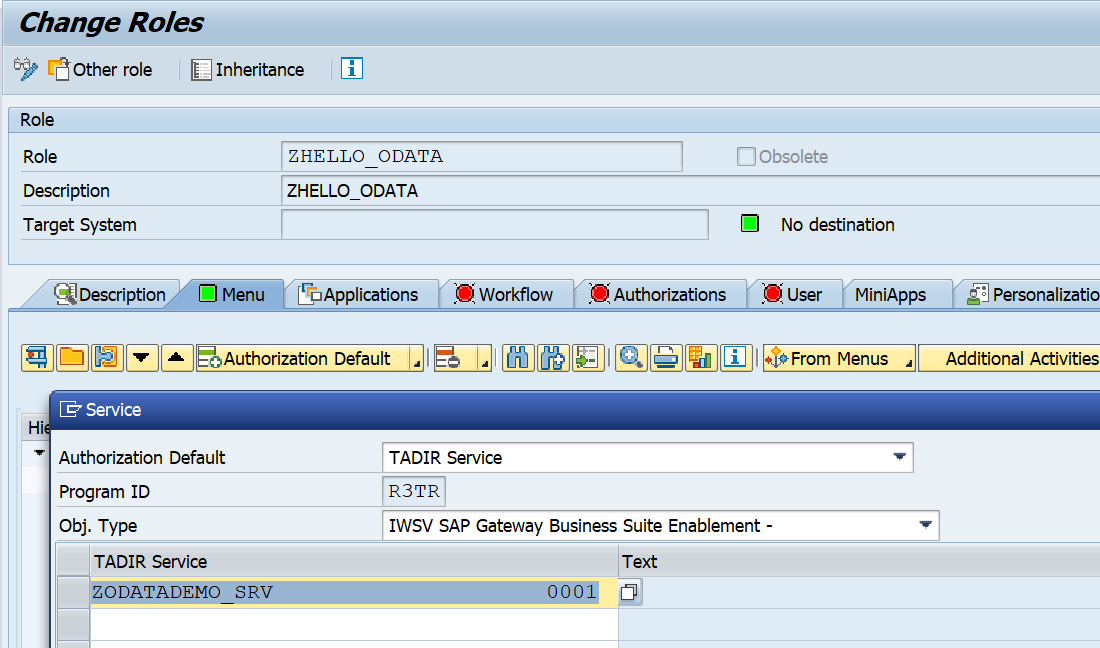
The user calling the ODATA service needs a special right in SAP to be allowed to call the ODATA service.
Start transaction PFCG and create a new role. On the menu tab select the option Authorization Default. Then select type Tadir and object type IWSV gateway business suite enablement. Now you can finally search for our own developed and activated ODATA service:
Now save the role and assign it to the user(s) needing to call this ODATA service.
The application security relies on the function security authorization check inside the RFC function module.
ODATA V2 and V4
SAP is now moving from ODATA V2 towards ODATA V4. Read more on ODATA V4 activation in this blog.
In the previous blog we have exposed a web service. Now we will show how to consume a web service in ABAP. As example we will consume the web service we exposed in the previous blog. This blog assumes you have configured the basic web service SOAP runtime (if not, read this blog).
Questions that will be answered in the blog are:
How to generate a web service consumption proxy?
How to setup SOAMANAGER for web service consumption?
How to test the web service consumption setup in SE80?
How to use the generated web service consumption proxy in ABAP code?
What are the authorisation and security aspects for web service consumption?
Generating web service consumption proxy
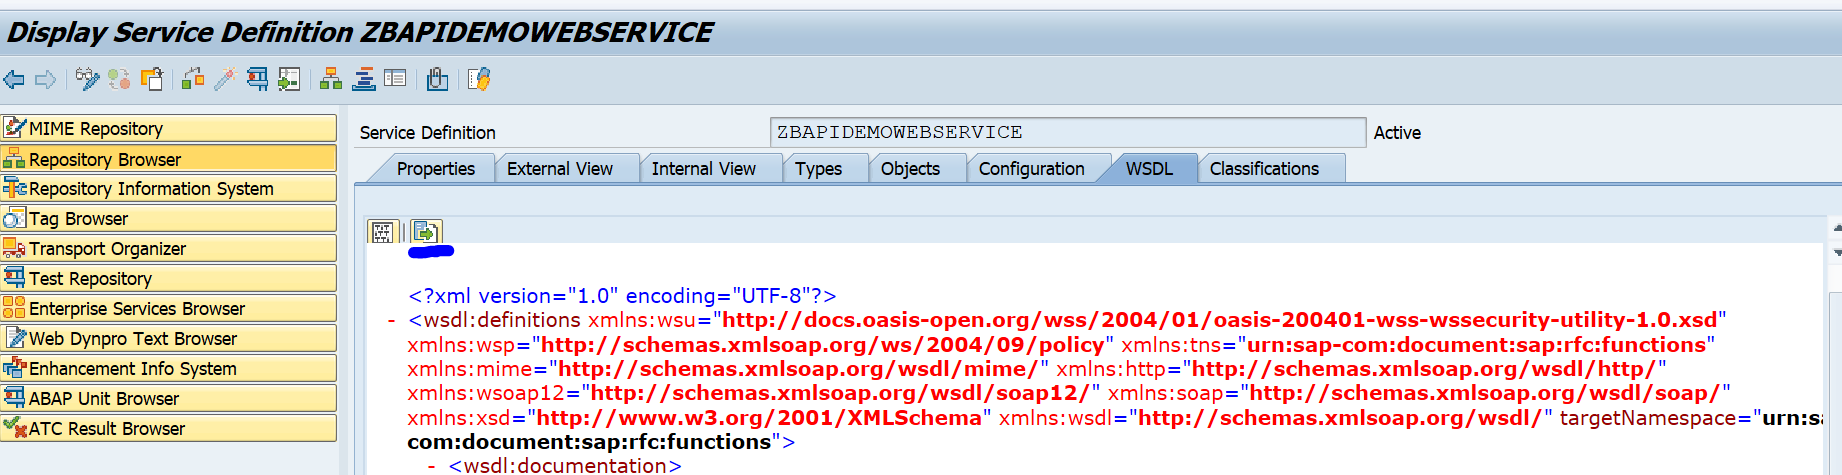
Start in SE80 by exporting the WSDL file from your previously generated webservice. Goto the WSDL tab and press export to save the WSDL file locally:
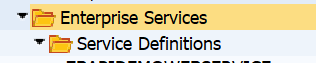
In SE80 in your package select Enterprise Services and right click on it to create a new service:
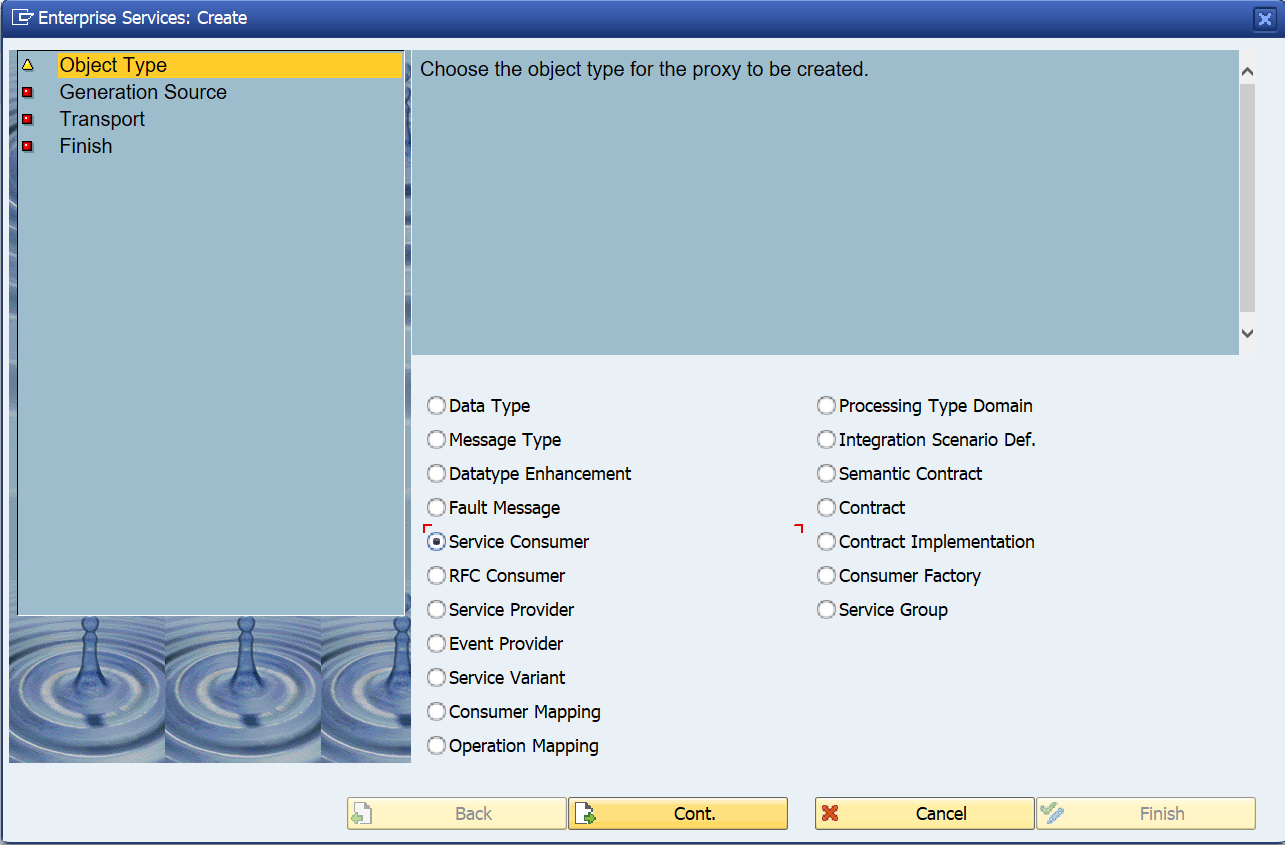
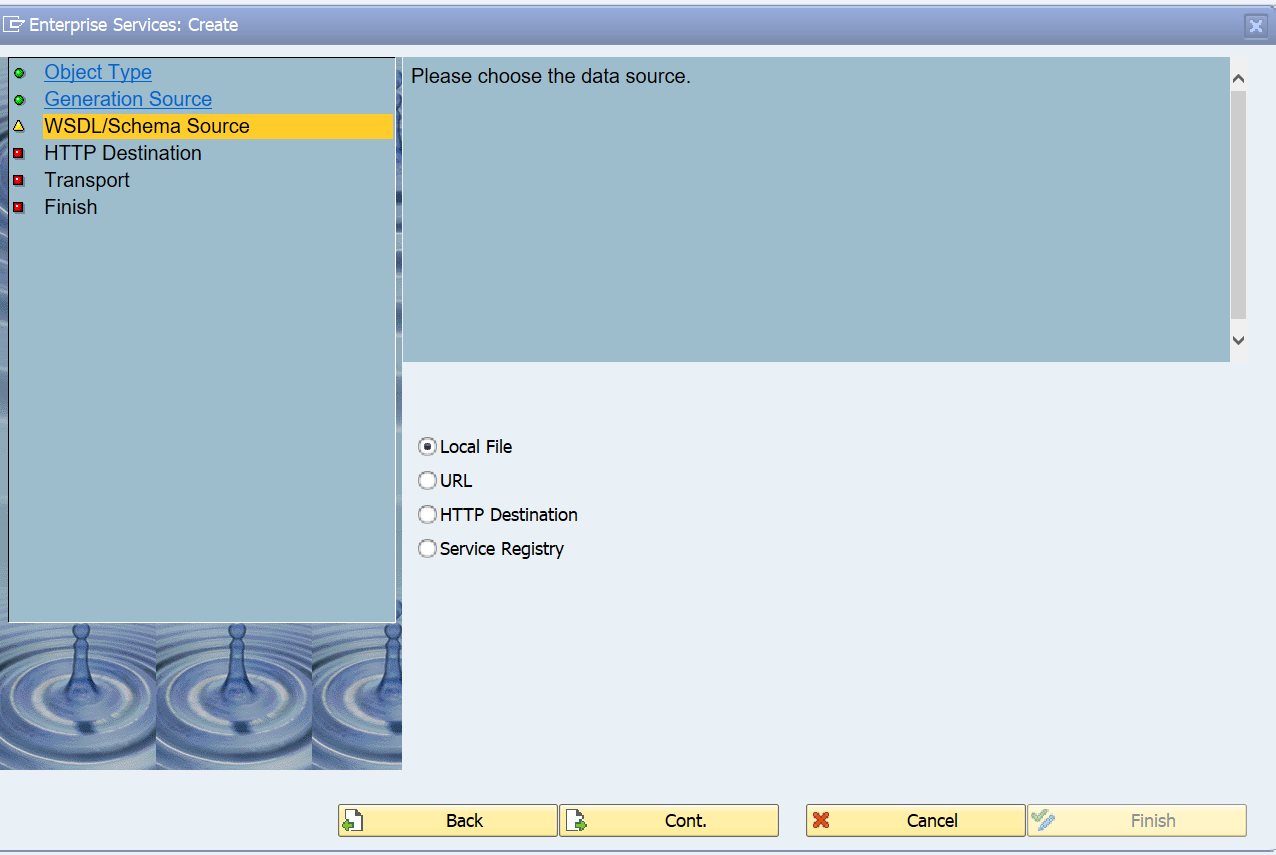
In the object type screen select Service Consumer:
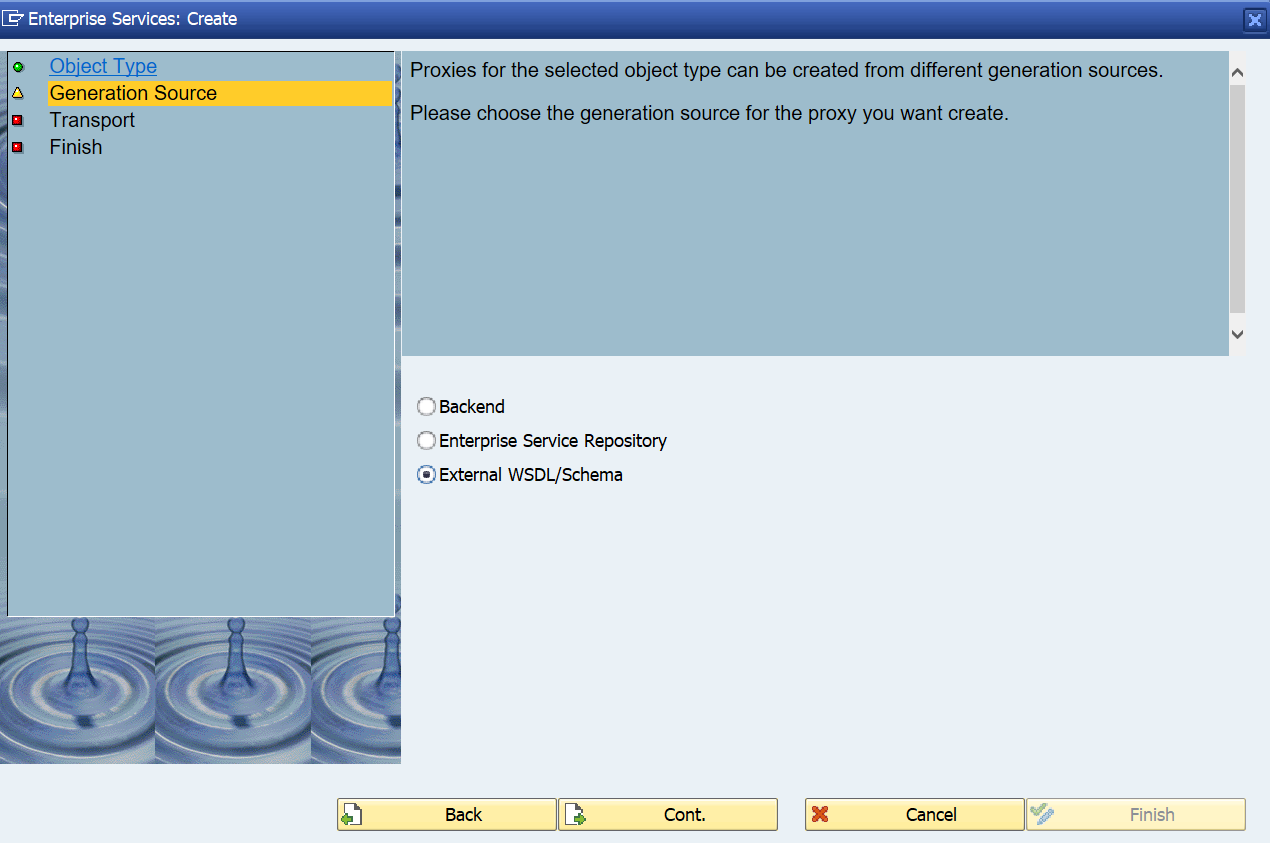
Now select External WSDL/schema:
Select local file:
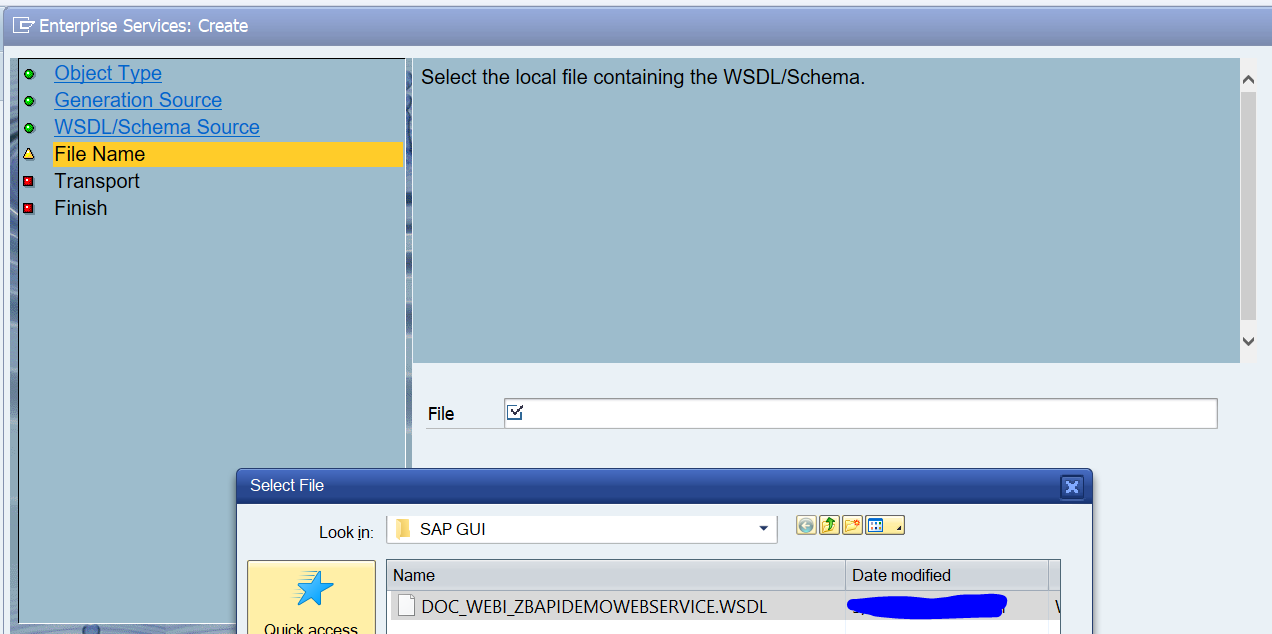
Select the local file:
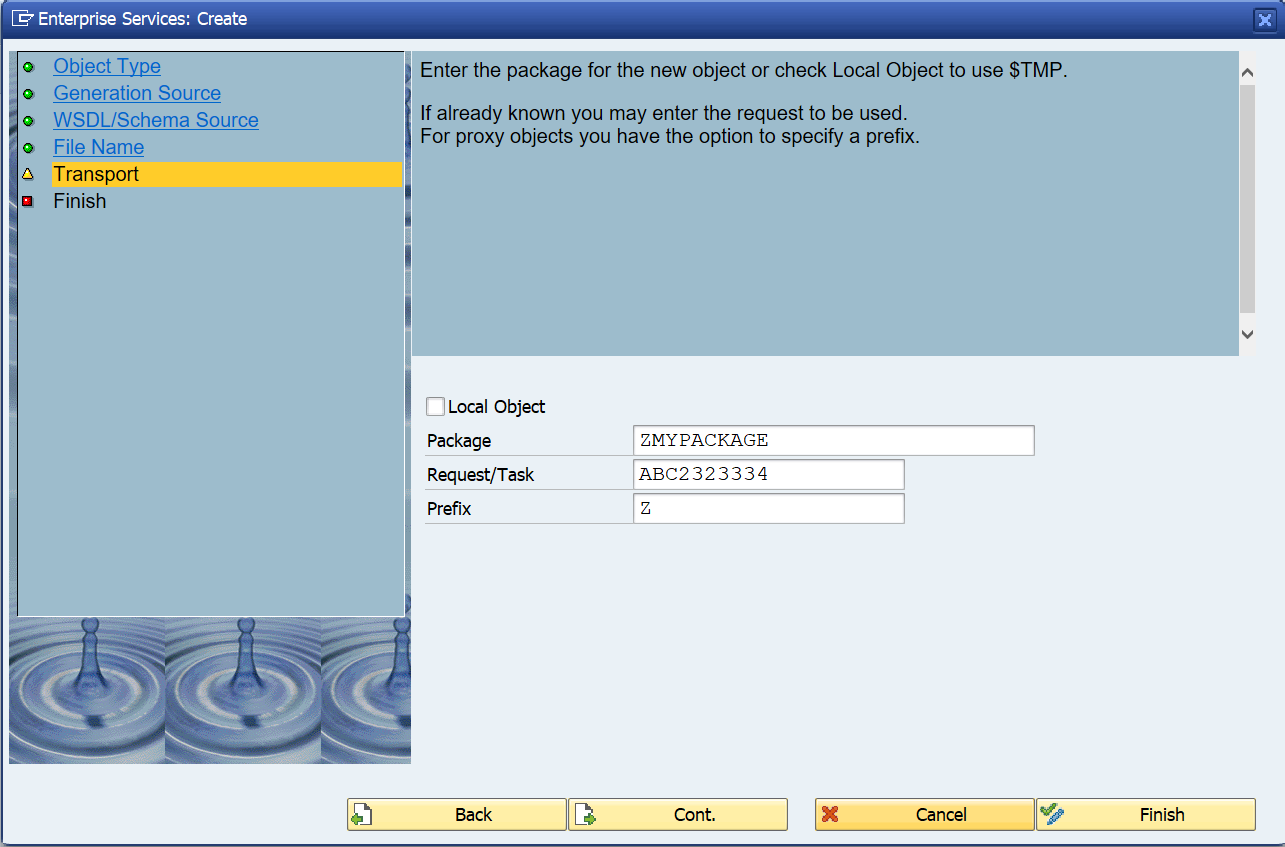
Select the package, transport and use Z as prefix:
Then select Finish to complete the roadmap.
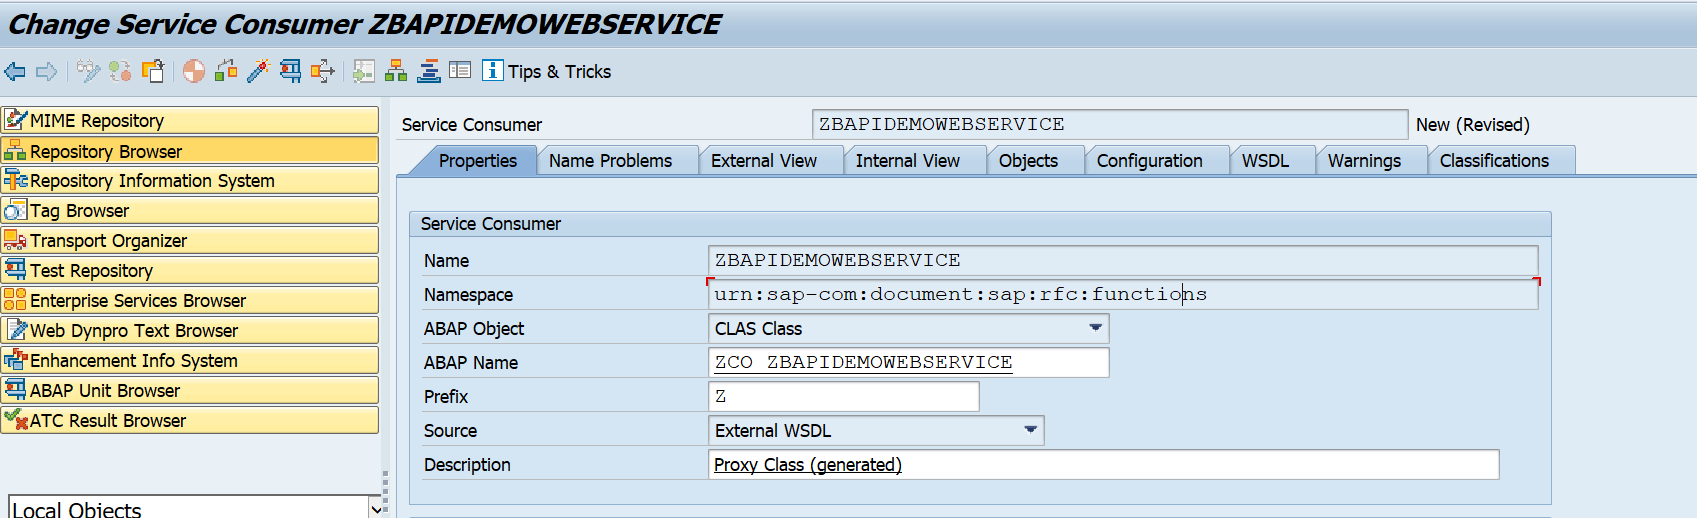
Wait for the system to compile the software:
Save and Activate. Now the design time proxy is ready.
SOAMANAGER settings
In the previous steps we have setup the design time proxy. Now we add the runtime artefacts as well.
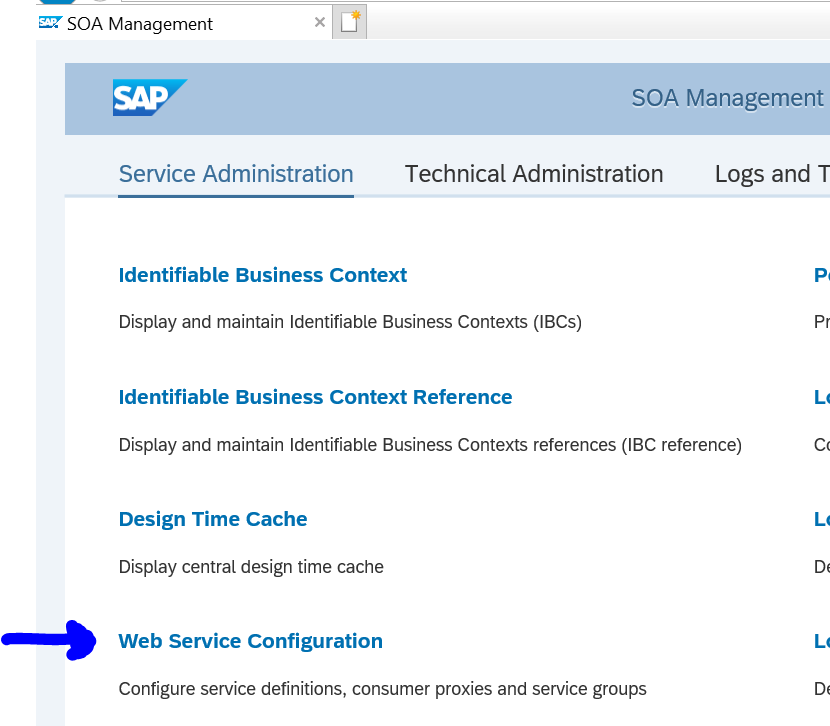
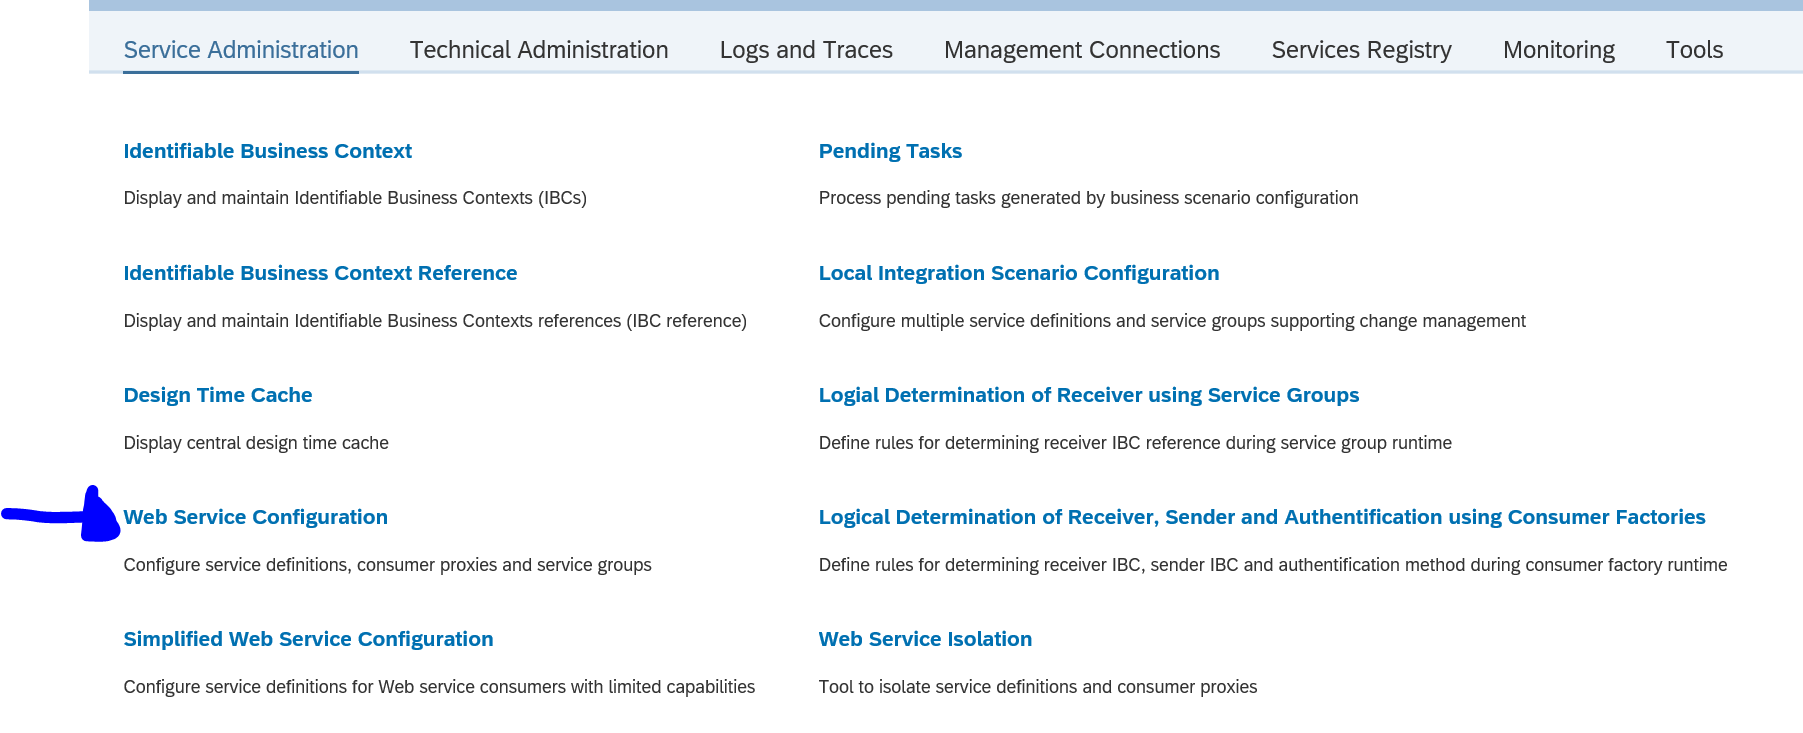
Now goto transaction SOAMANAGER:
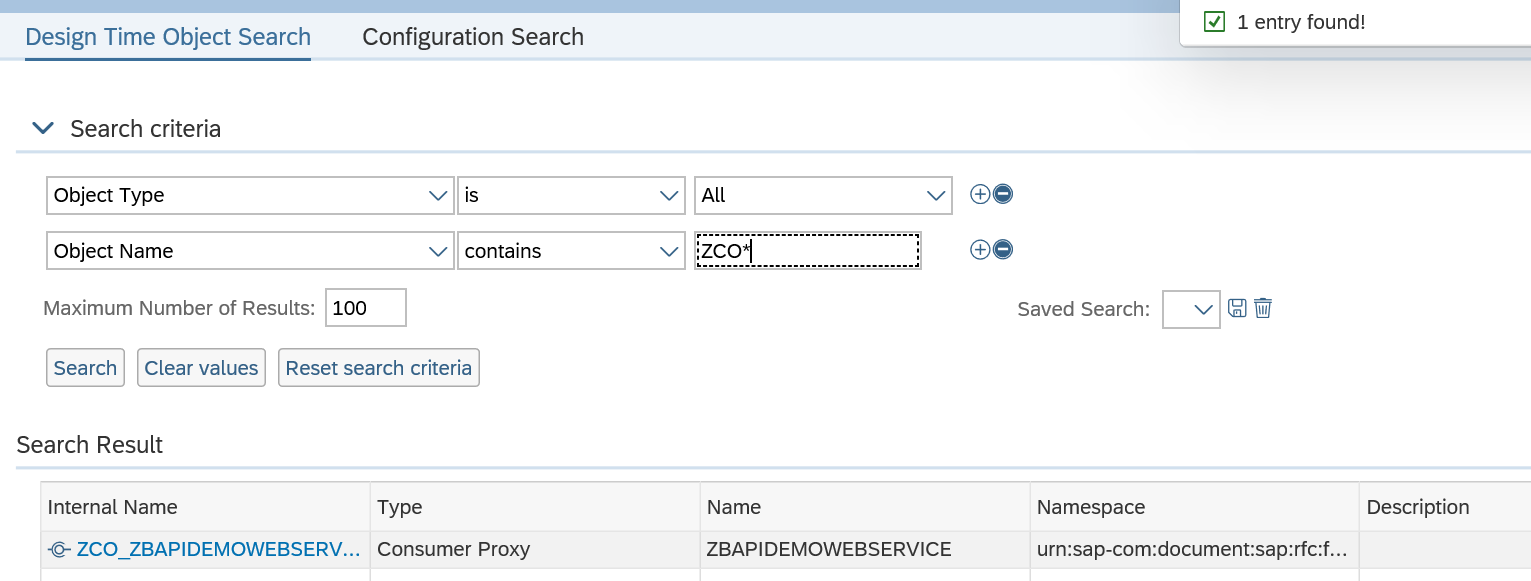
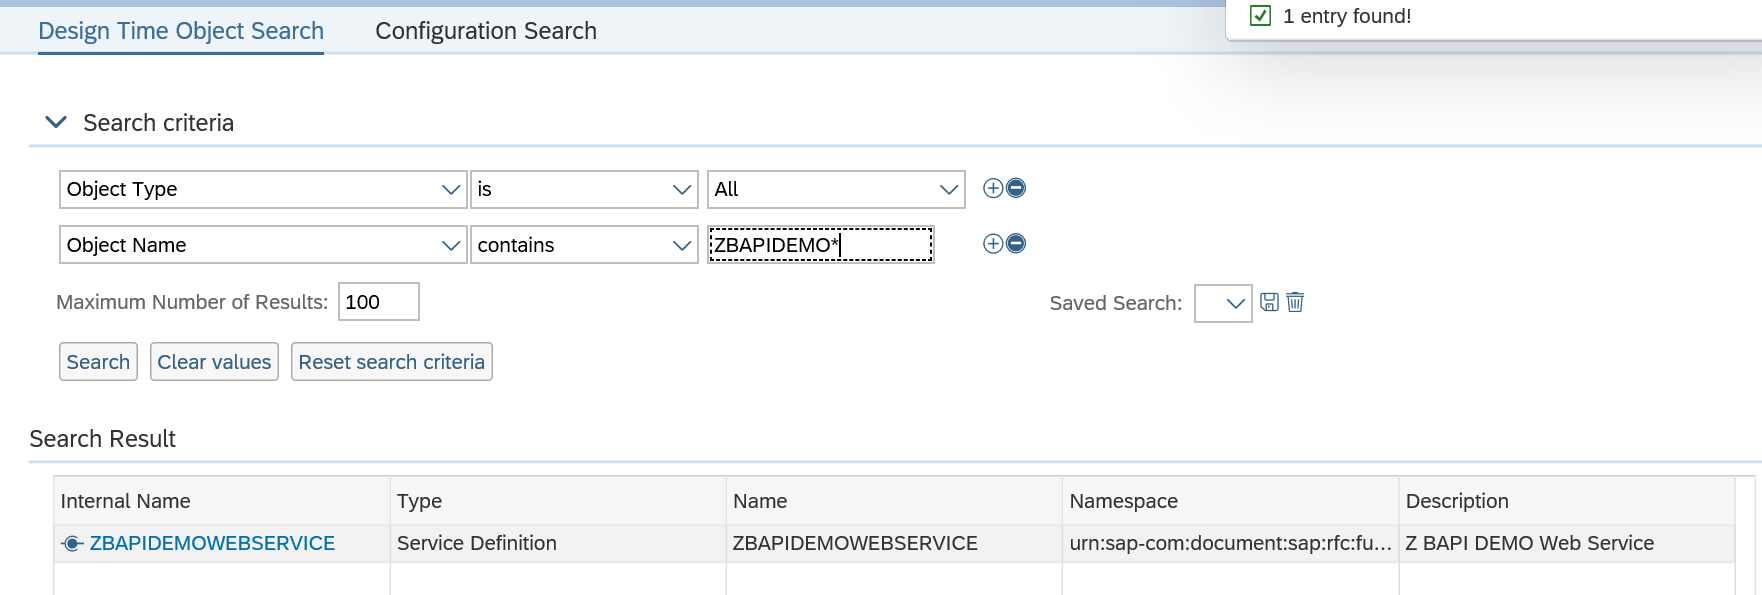
Select Web Service Configuration, and search for the newly created design time object:
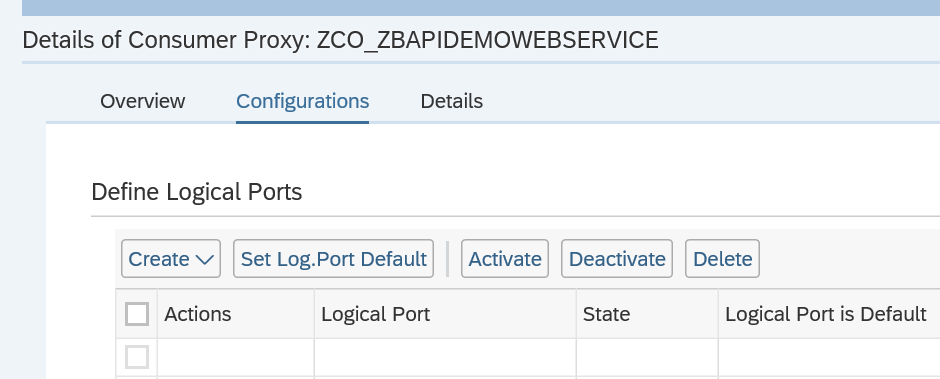
Click on the blue internal name to reach the configuration screen:
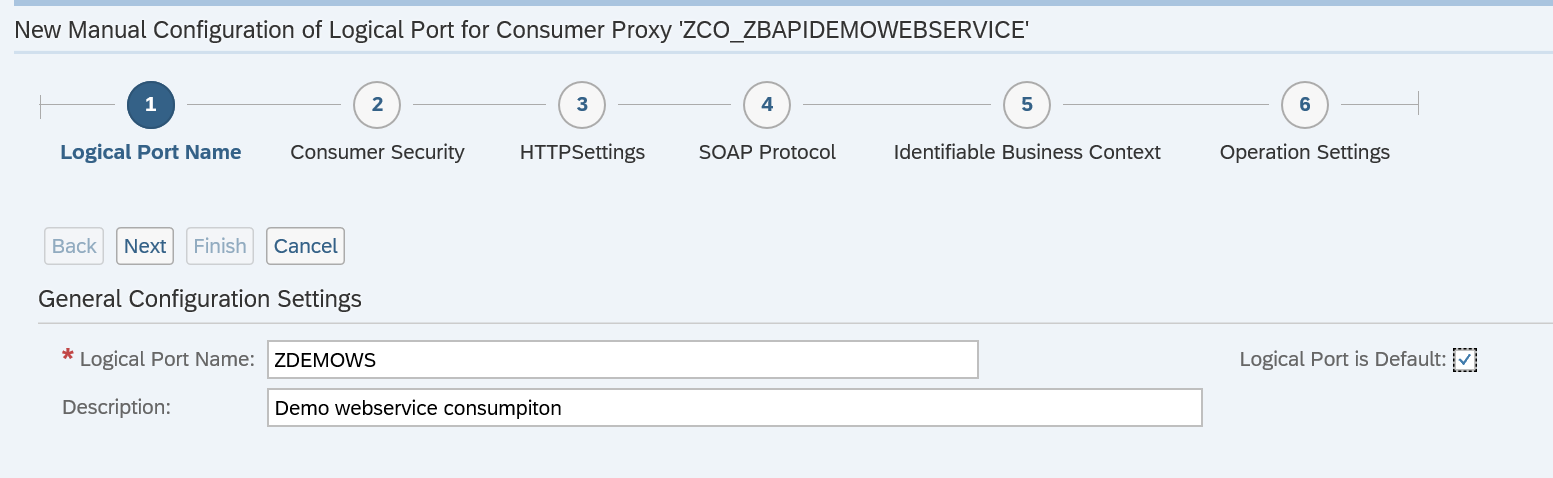
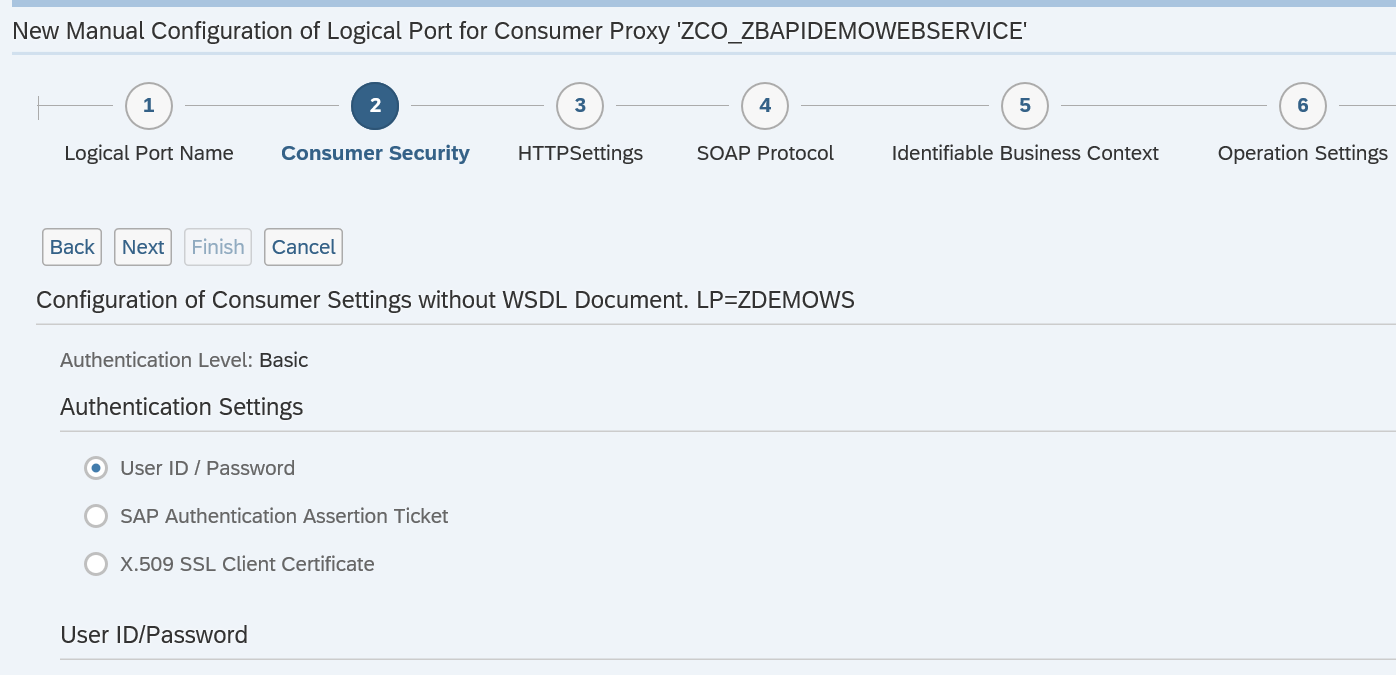
On the screen press Create and then manual configuration:
Give the logical port a name and description and mark the logical port is Default tickbox to true. Then continue with the roadmap.
Now fill out user ID and password. Continue and fill out user ID and password:
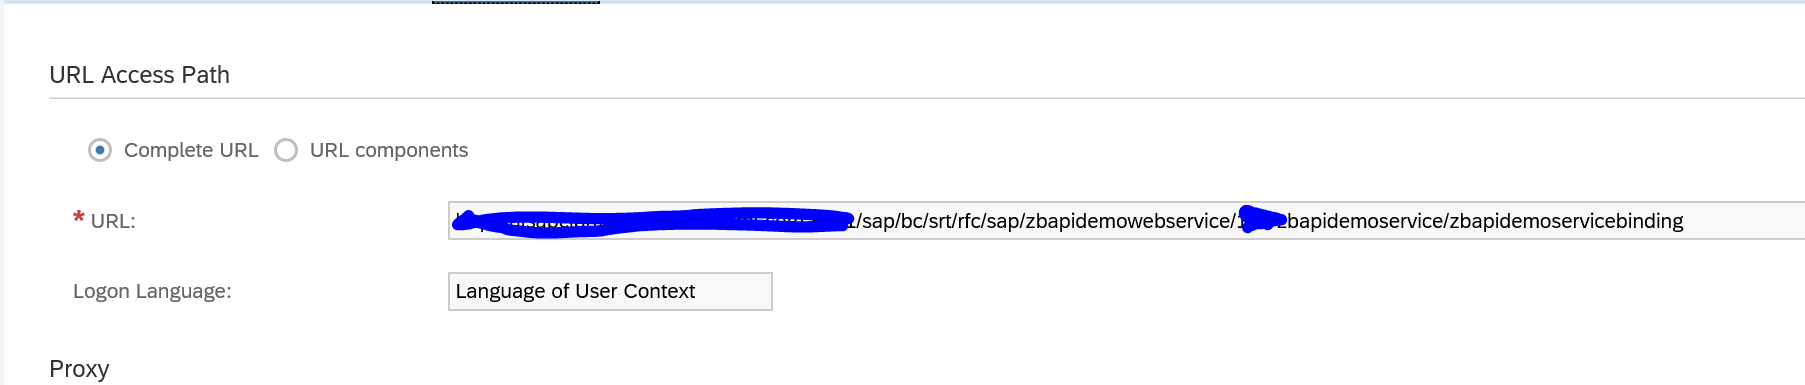
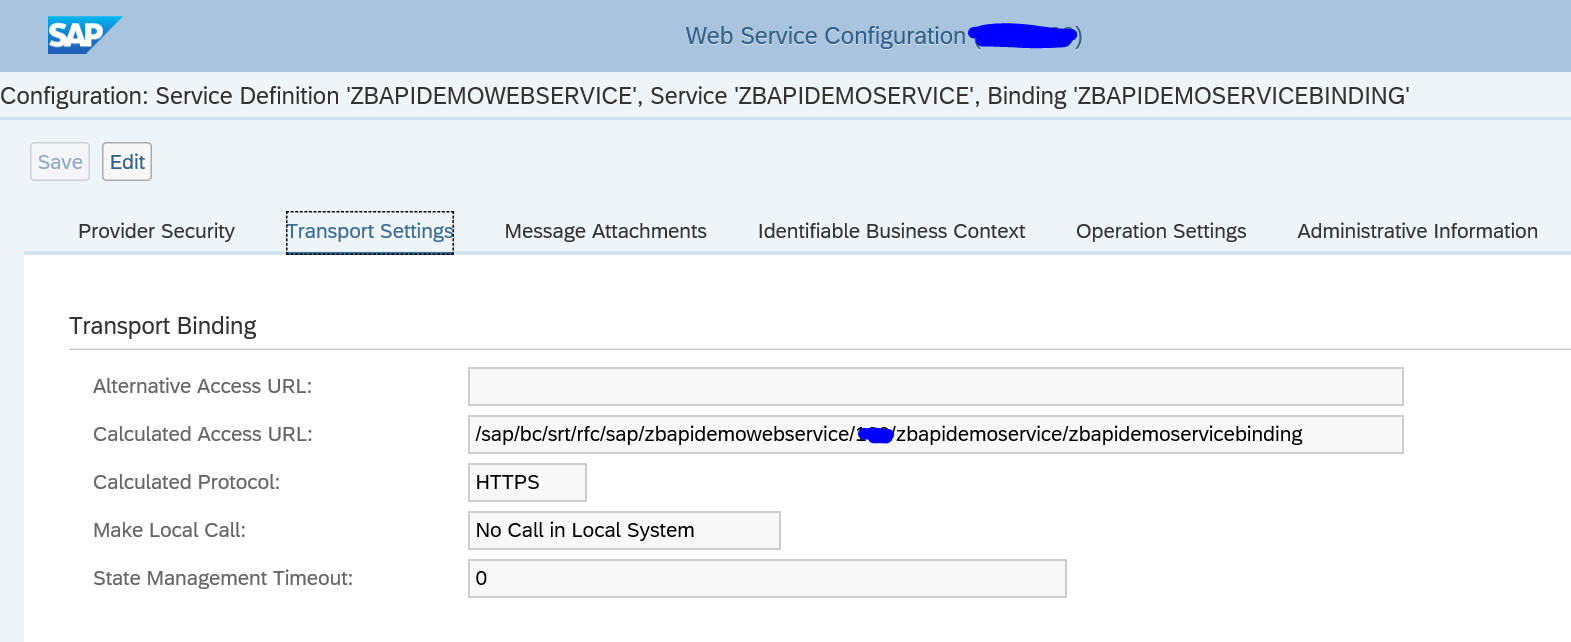
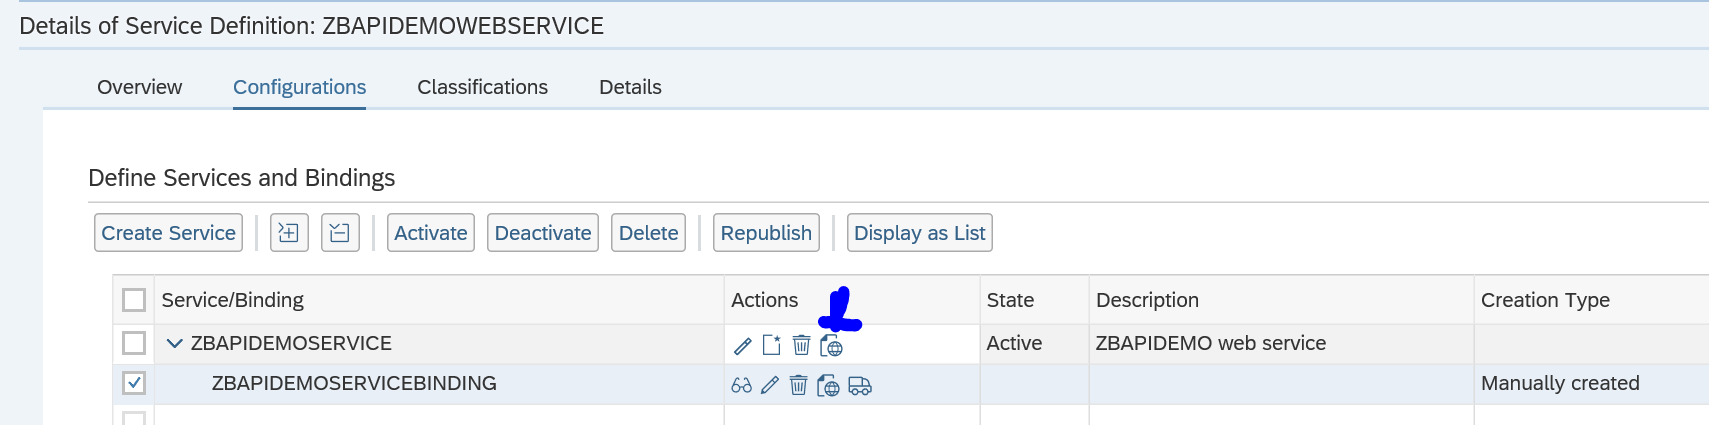
You can lookup the access URL from the service defined in the previous blog and check on the transport settings tab:
Do not use the WSDL URL address, but the binding URL!
Now fill out the URL details in the next screen.
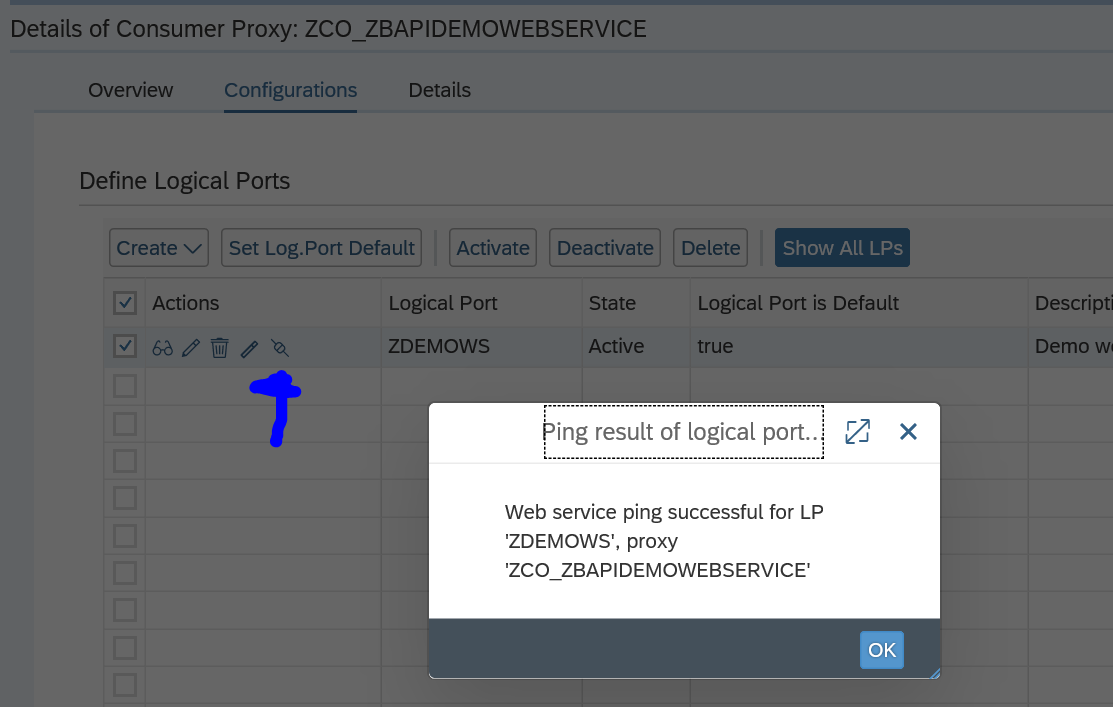
Now finish the roadmap. And on this screen hit the ping web service test button to check if all is ok:
The design time artefacts can be transported. The SOAMANAGER settings need to be repeated in each system. This is wanted as well, since on a test system you might want to call a test web service URL and on production the same web service from the production URL.
Testing the web service consumption setup
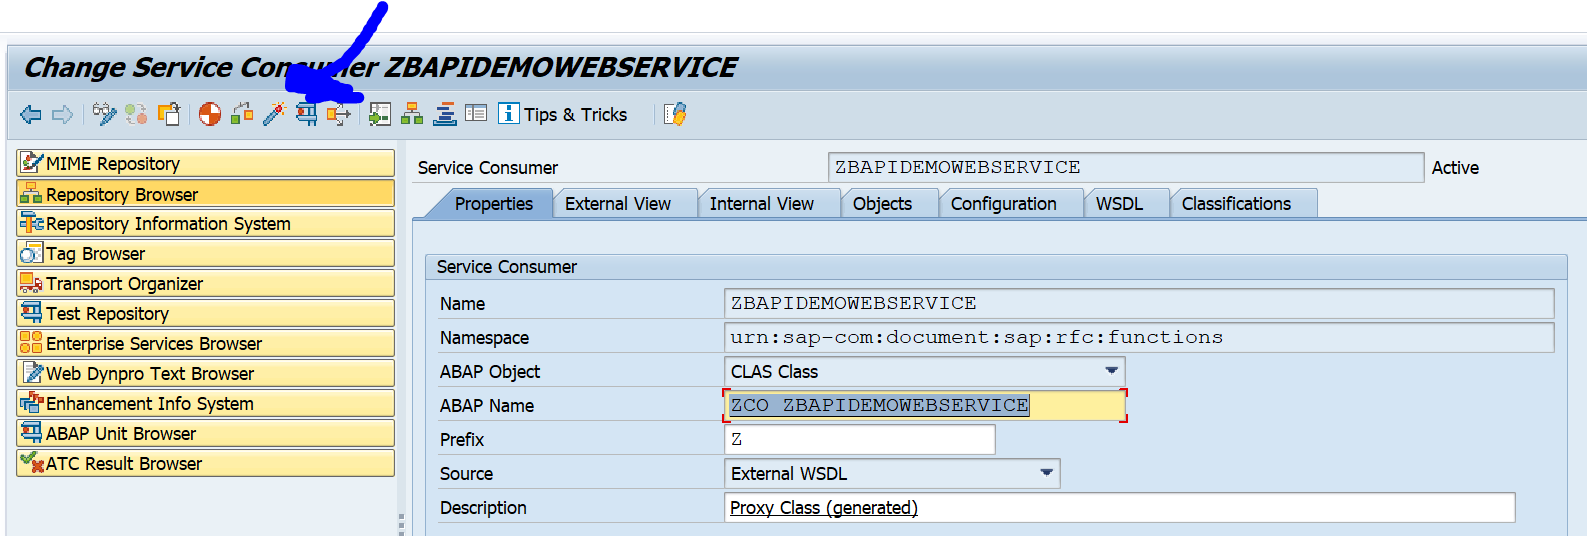
Now go back to SE80 and test the web service consumption:
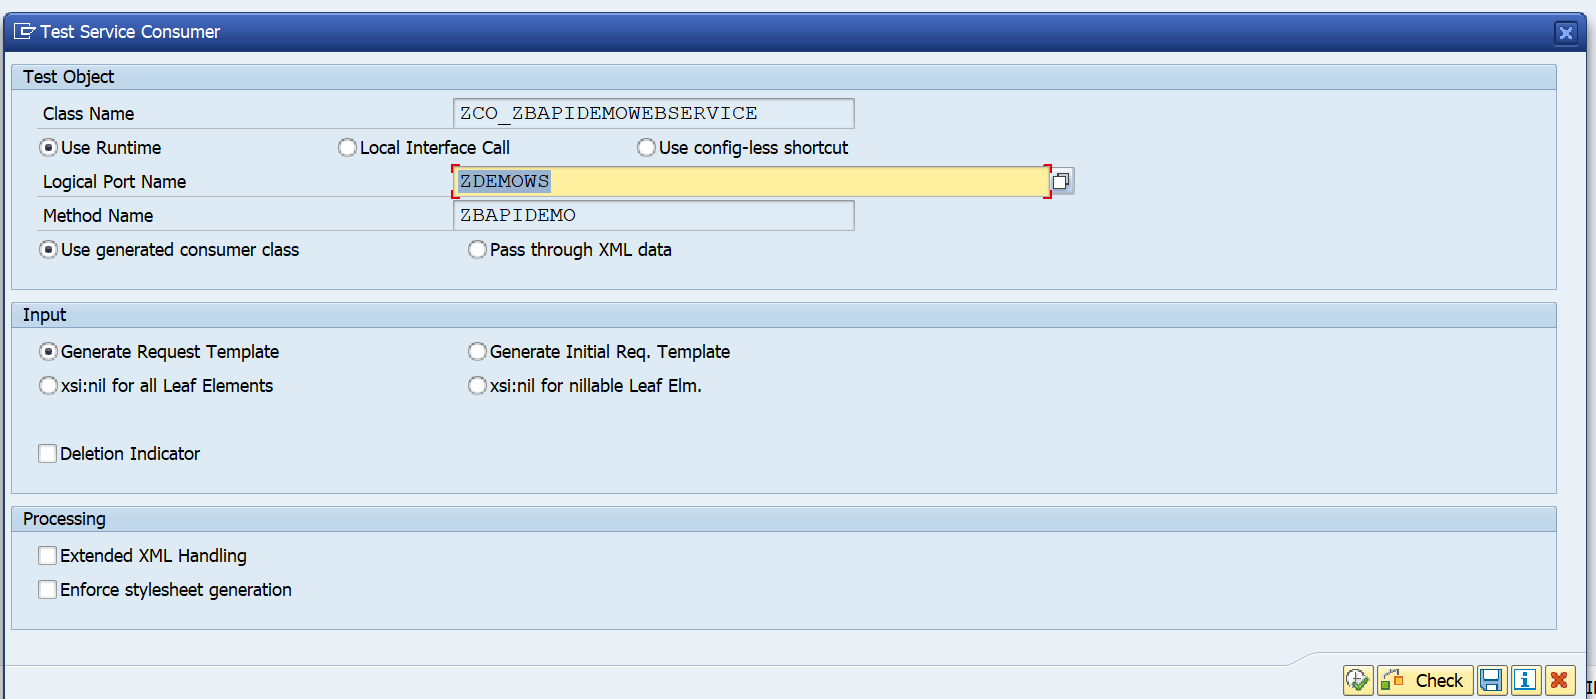
Select the port you created above in SOAMANAGER:
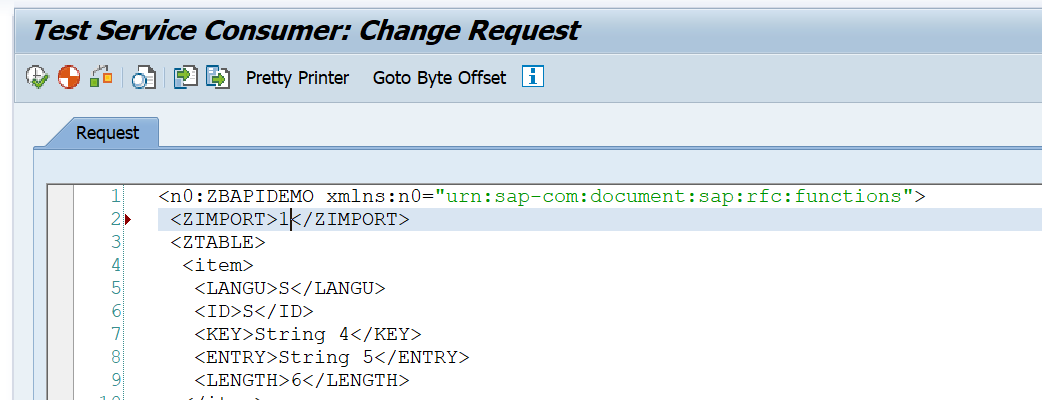
Edit the data:
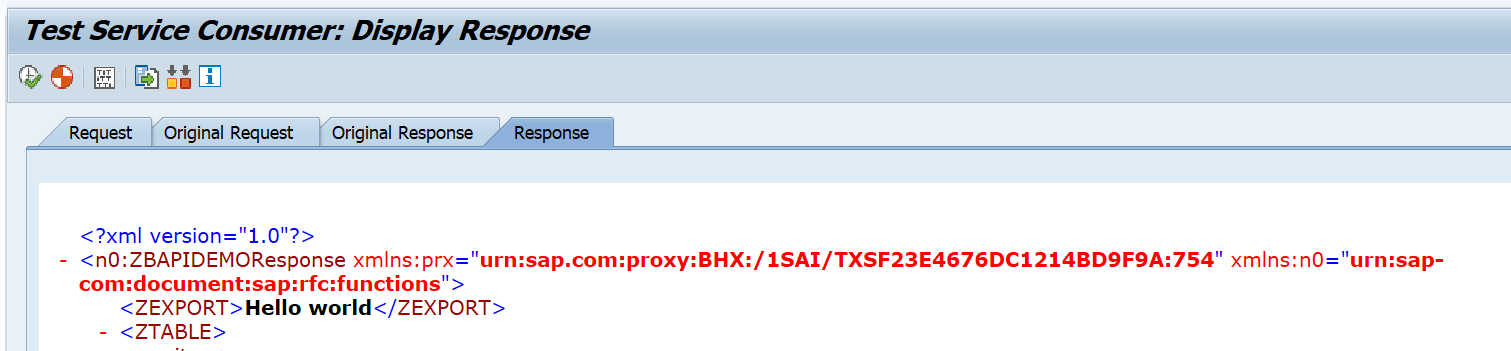
And press test to get the results:
Using the web service consumption proxy in ABAP code
Now we are ready to use the web service consumption proxy in our ABAP code. ABAP code example:
* Data Declarations DATA: zcl_proxy TYPE REF TO zco_zbapidemowebservice, " Proxy Class zdata_in TYPE zzbapidemo, " Proxy Input zdata_out TYPE zzbapidemoresponse, " Proxy Output zfault TYPE REF TO cx_root. " Generic Fault
* Instantiate the proxy class providing the Logical port name CREATE OBJECT zcl_proxy EXPORTING logical_port_name = 'ZDEMOWS'.
* Set Fixed Values zdata_in-zimport = '1'.
TRY . zcl_proxy->zbapidemo( EXPORTING input = zdata_in IMPORTING output = zdata_out ). WRITE: / zdata_out-zexport. CATCH cx_root INTO zfault. * here is the place for error handling
ENDTRY.
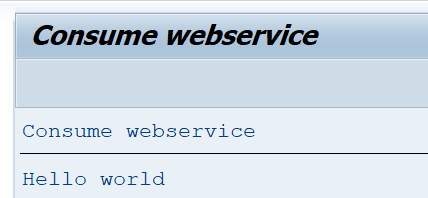
Run the ABAP and see the result:
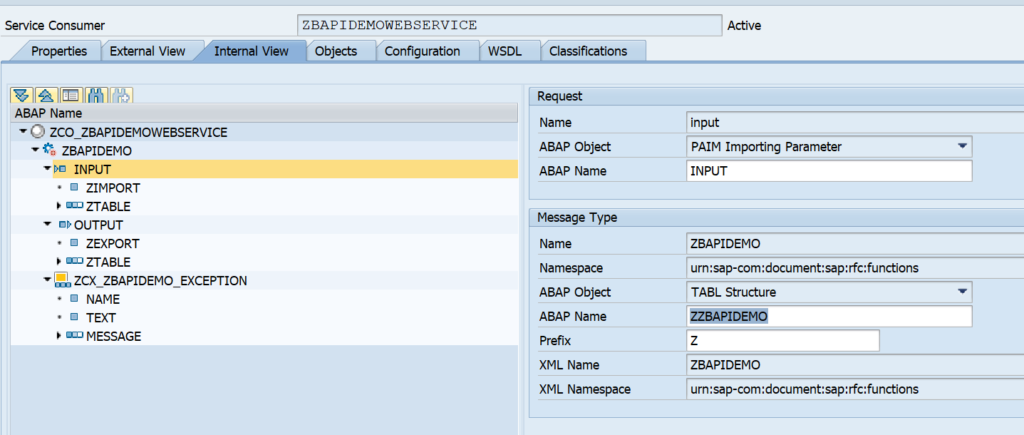
How to get the right parameters? All the required structures can be found on the SE80 ABAP web service consumption proxy internal view:
Authorizations
The end users using the ABAP that is consuming the web service must be given the rights for the correct S_SERVICE object. Otherwise they will get an error that they are not authorized to call the proxy service object.
Monitoring the availability of the web service
It was explained you can test the connection. Unfortunately there is no out of the box way to test this connection in a batch job on a frequent basis. If you want to frequently test and be alerted on issues with connection to the web service, you can read this blog to deploy a simple custom program that executes this function and can be planned in the background.
Background notes and blogs
More information and details can be found in these 2 SAP wiki’s: wiki1 and wiki2.
In the previous blog we have created a test RFC module. We now will expose this test RFC module as web service. This blog assumes the basic SOAP web service runtime has been done according to the manual in this blog.
If you are looking for information on how to consume a web service in the ABAP stack: read this blog.
Questions that will be answered are:
How can I generate a web service design time based on an RFC module?
How do I activate the web service runtime via SOAMANAGER?
How do I test my web service?
Creating the web service based on RFC module
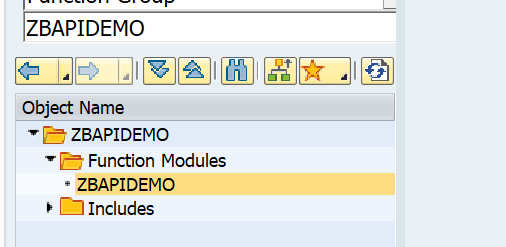
Goto transaction SE80 and search for the test BAPI:
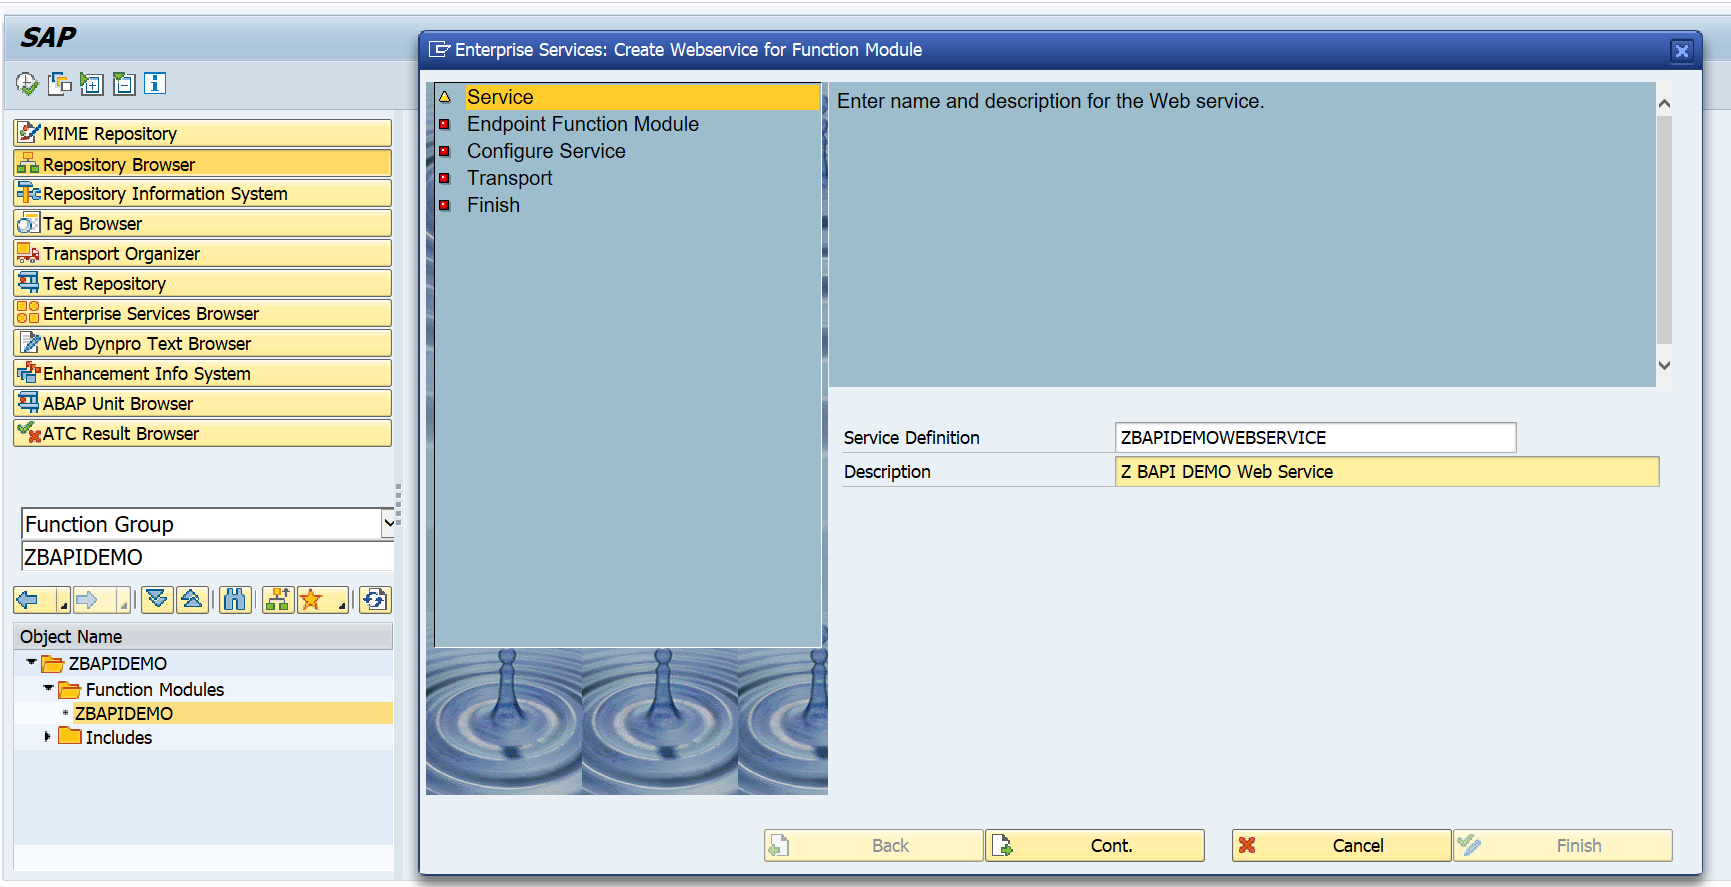
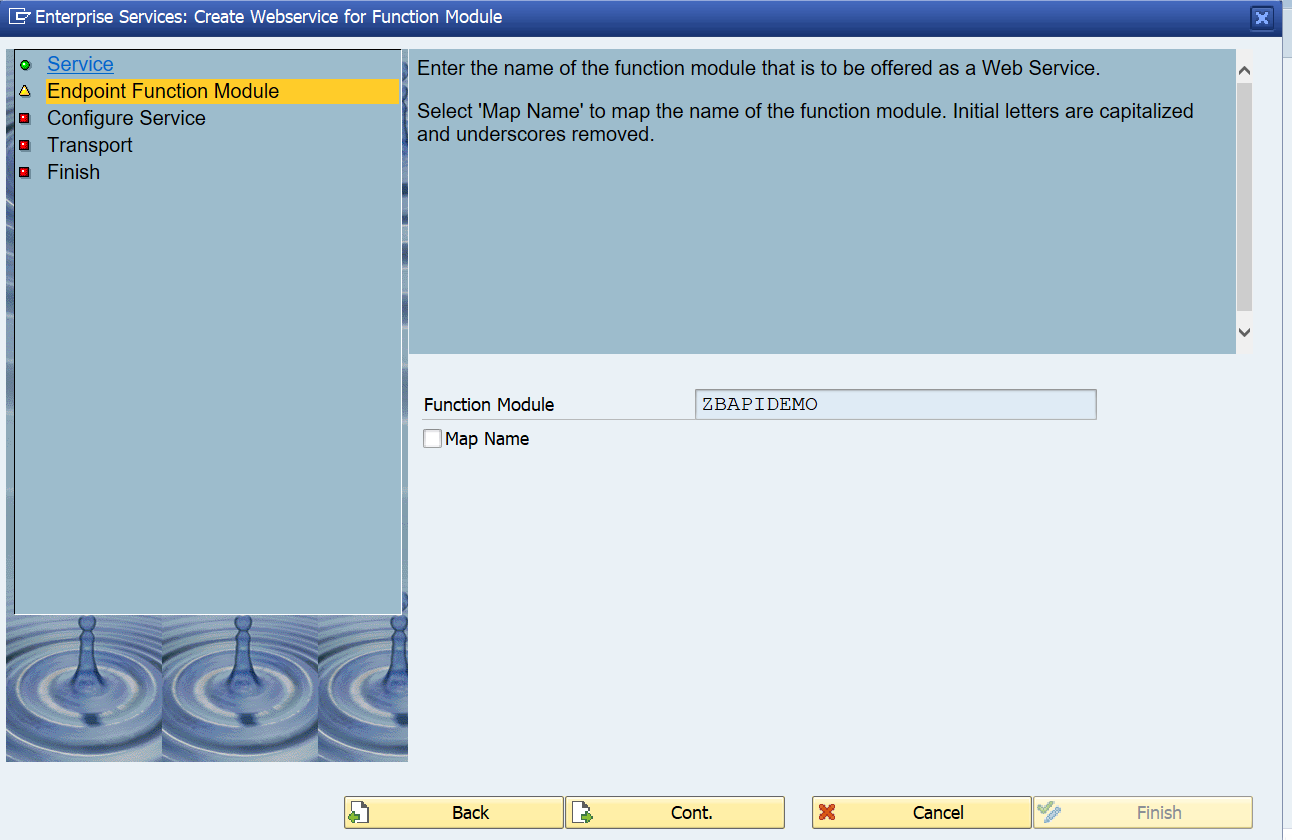
Now right click on the name ZBAPIDEMO function module and select the option Create / Enterprise Service:
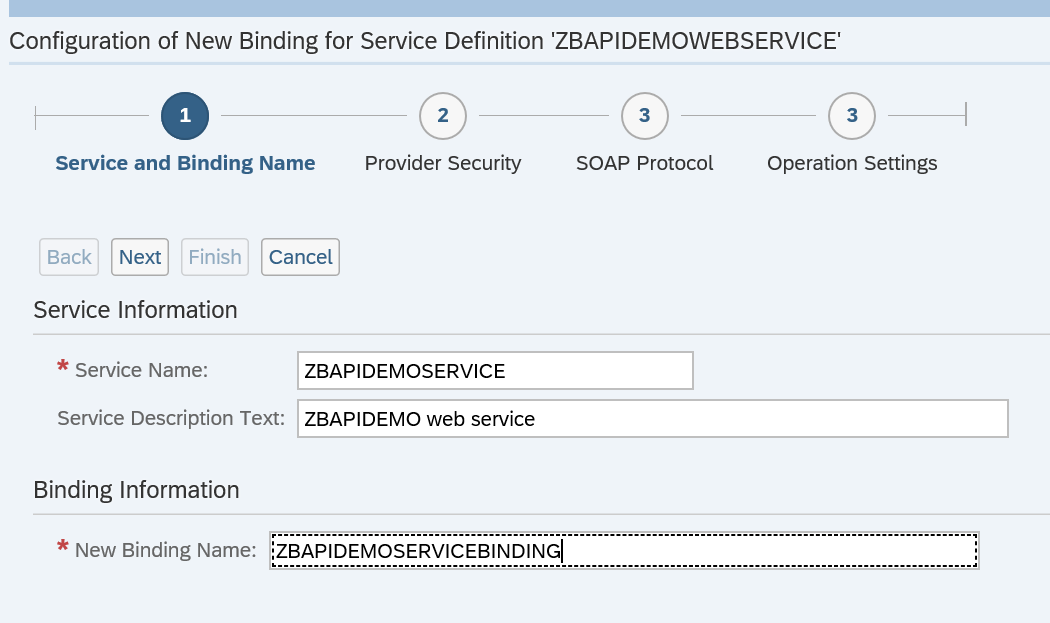
Fill out the name for the service definition and the description. Press Cont. to continue to the next screen:
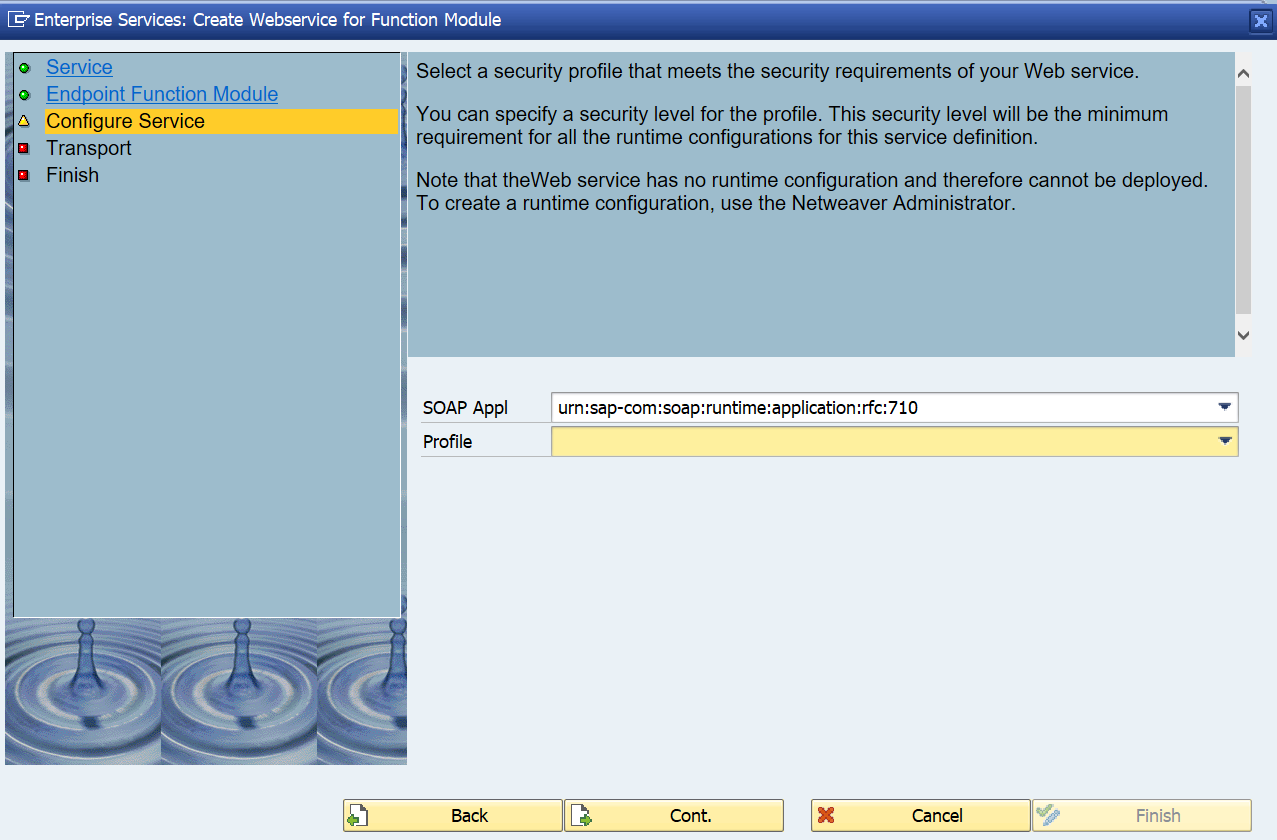
Press Cont to go to the next step:
Press Cont. to go to the next screen:
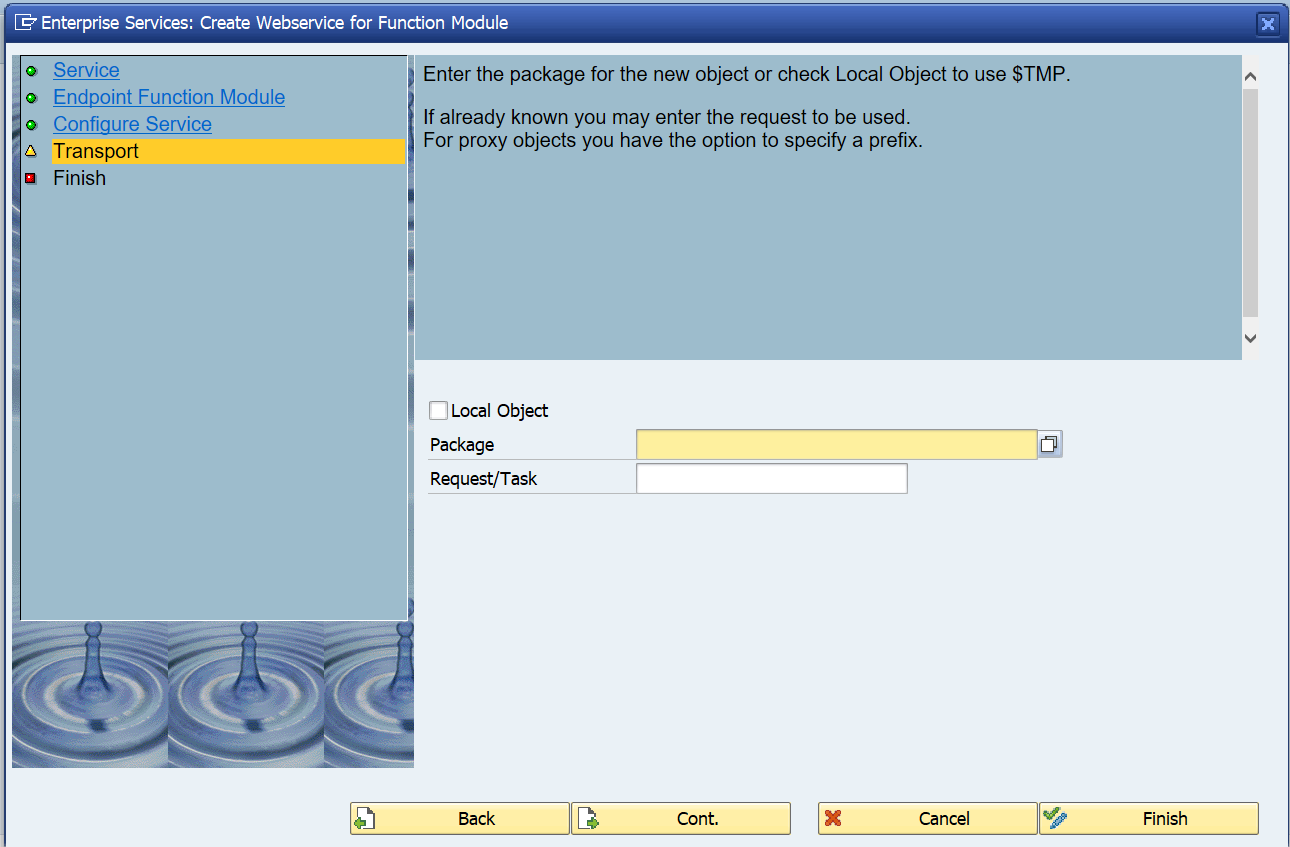
Fill out your package and transport request.
Important here: on a sandbox you might want to use a local object ($TMP). In a development system, NEVER use the local option. A lot of data structures and coding will be generated. If you later try to move the objects from $TMP to a real package, you will be faced with a lot of issues. See note 886682 - Proxy inconsistencies on the use of repair programs SXIVERI_PROXY_HASHID_CHECK and SXIVERI_PROXY_HASHID_CHECK_70. After the cumbersome and painfull repair you will not make the mistake again...
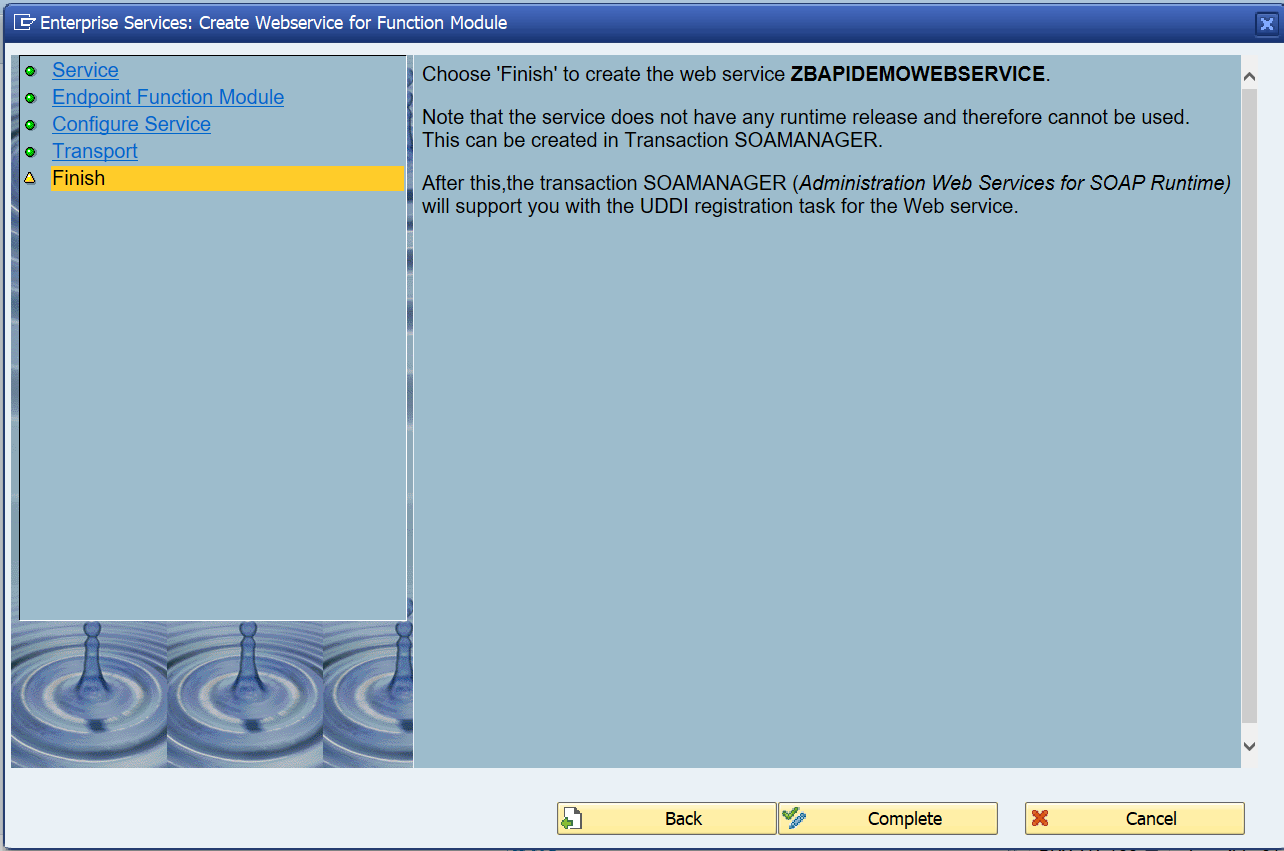
Press Cont. to goto the last screen:
On the screen you can already see the next action after completion: SOAMANAGER. But first press Complete to start the generation of the objects.
After the generation, do not forget to Activate the objects!
Activation success message:
Setting up the runtime with SOAMANAGER
To setup the runtime, start transaction SOAMANAGER. It is assumed that the basis team has performed the initial SOAP runtime setup. If not done, ask the basis team to follow the steps in this blog.
On the SOAMANAGER start screen choose the option Web Service Configuration:
In the next screen search for the design time object we created and activated in the previous section (if you forgot the activate, you will not find it now…):
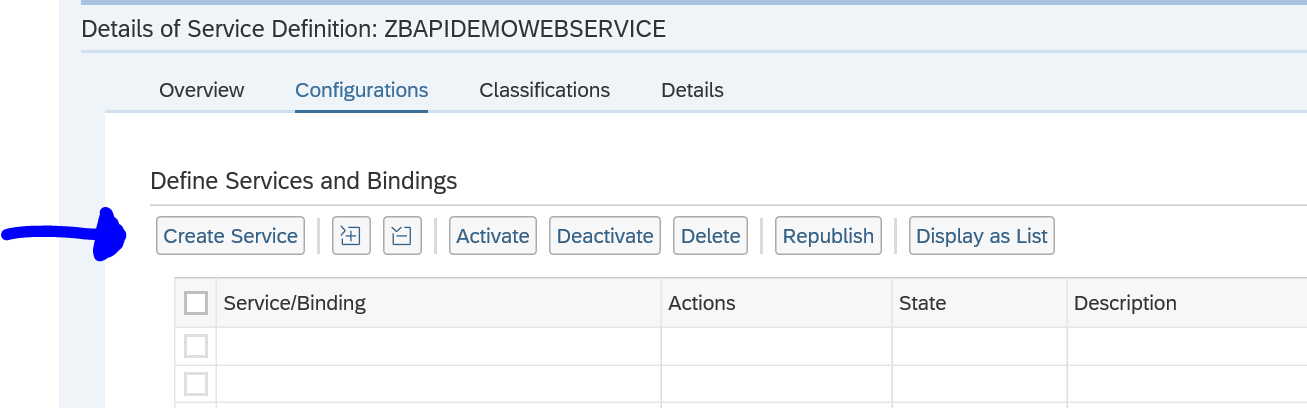
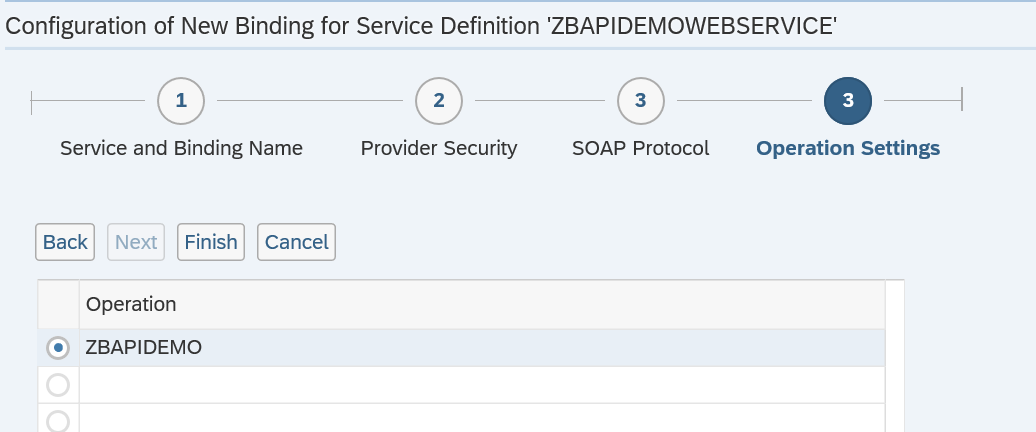
Select the service and on the next screen press the button Create Service:
Fill out the definition details:
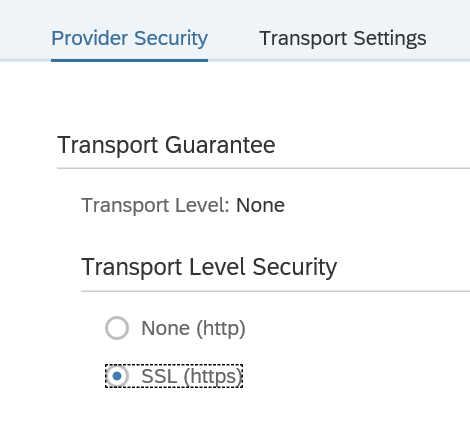
Press Next and define the security settings:
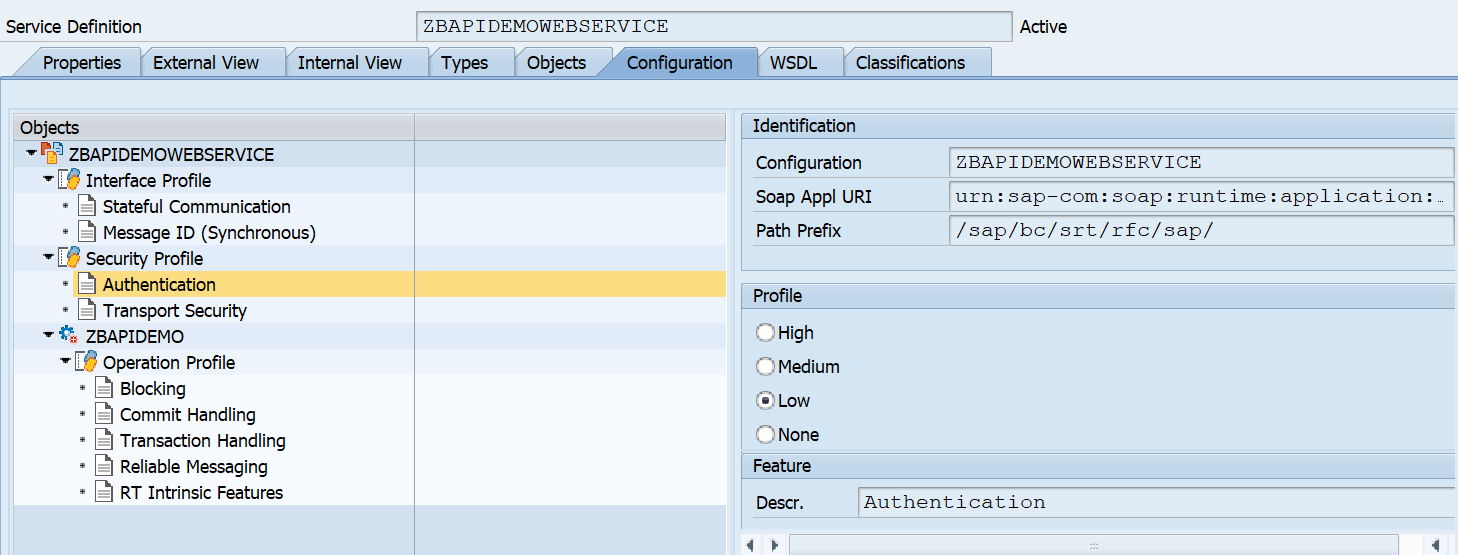
Remark: in the newer versions, the default security is set to high. If you need lower security, go back to SE80 definition in the tab configuration to change the security profile (save and regenerate!):
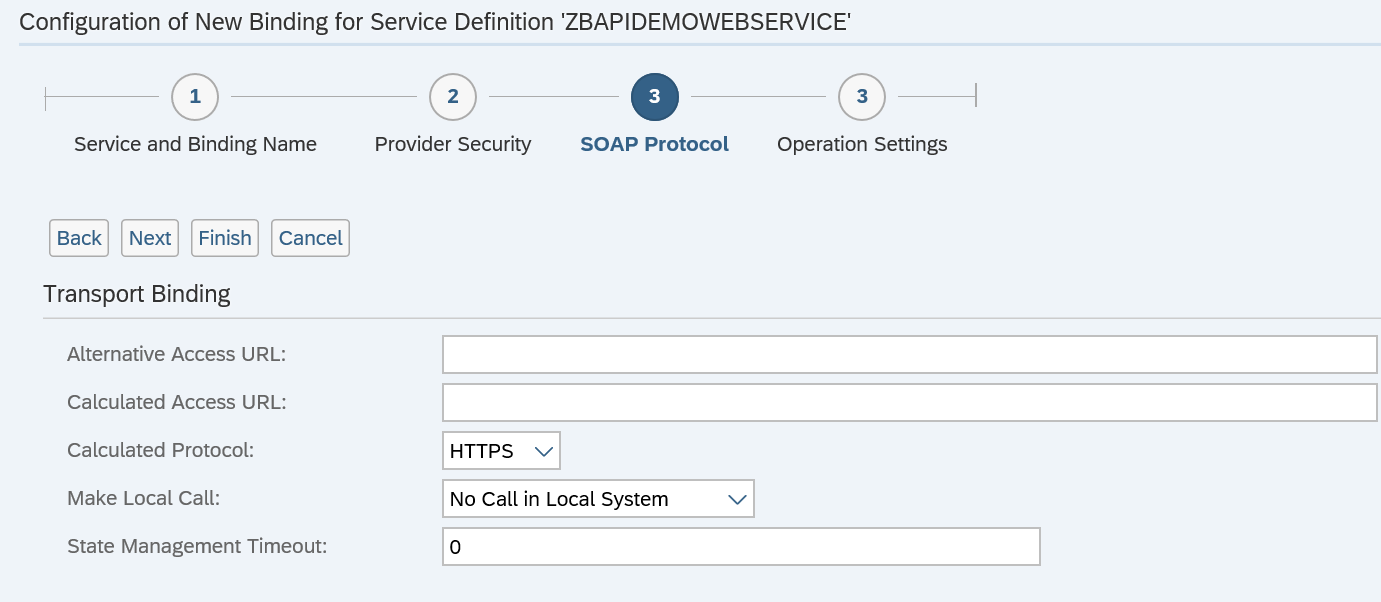
Press next and define the SOAP protocol settings:
On the last screen of the wizard press finish:
Wait for the runtime generation to finish.
The screen returns to the generated runtime artifacts:
The most important artifact is WSDL file which you can open from here.
Testing the service
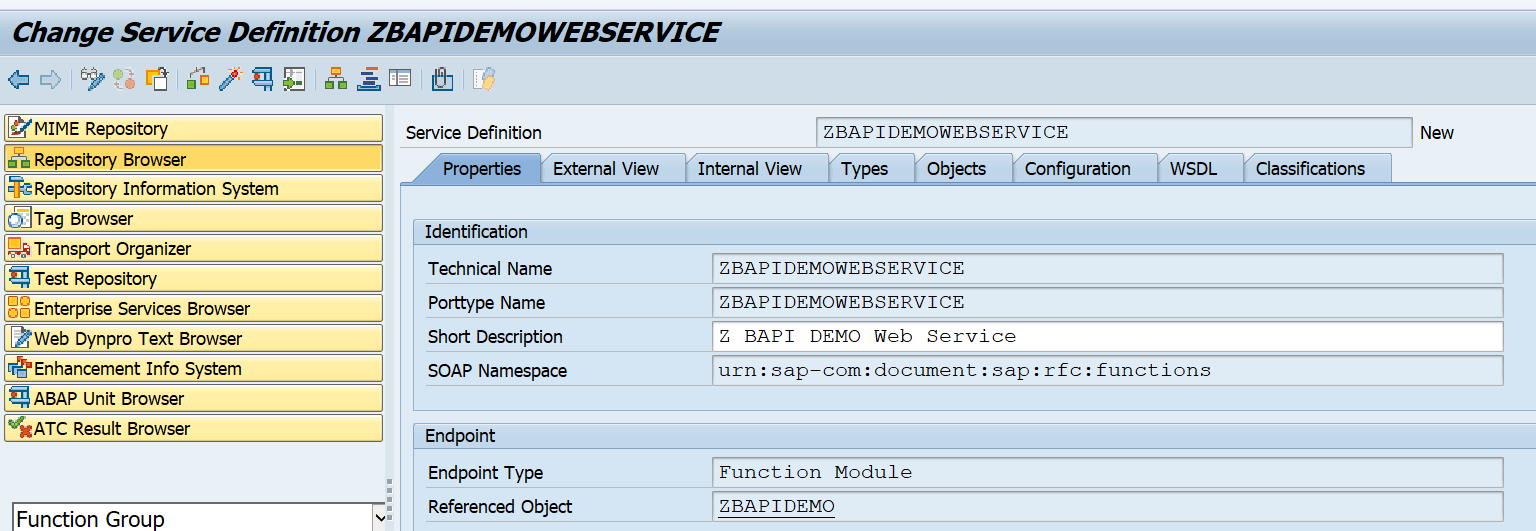
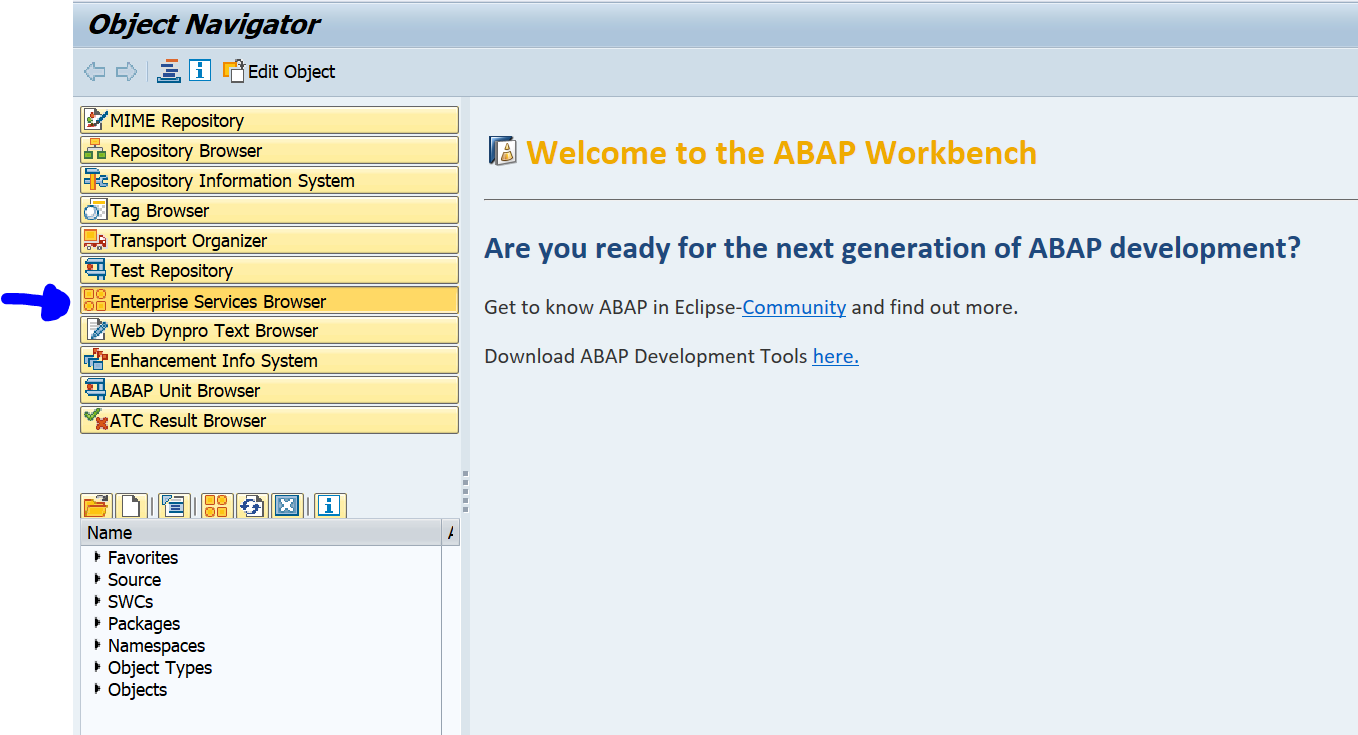
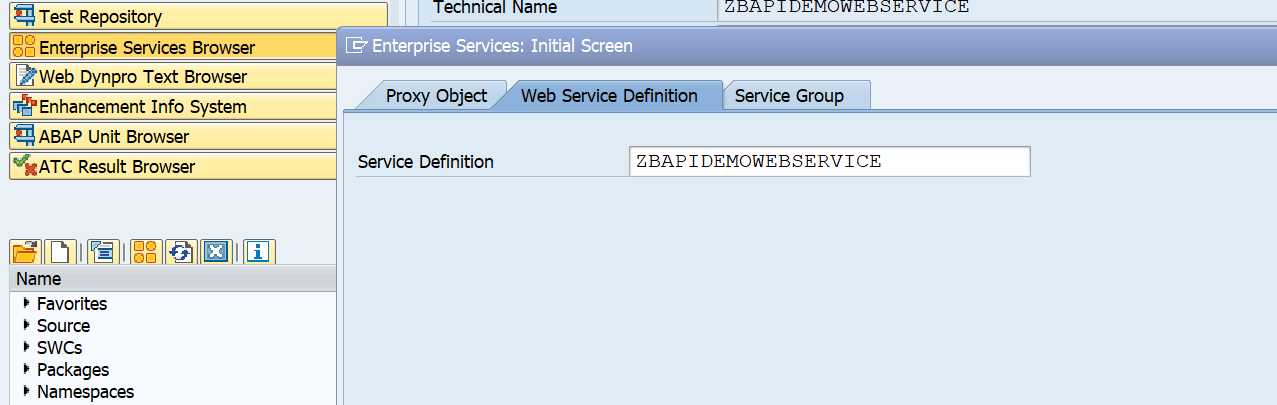
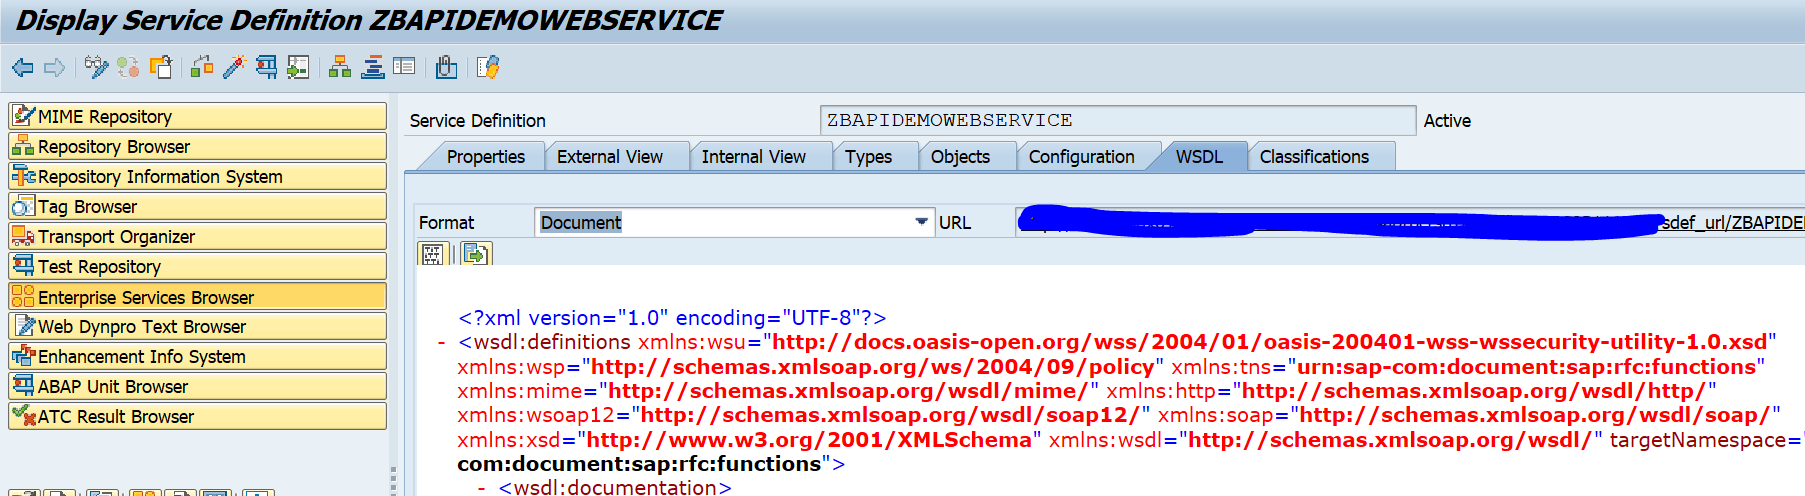
Go to transaction SE80 and select the Enterprise Services Browser (if not visible go to menu path Utilities/Settings and add the tool):
Now open your service by clicking the Open Object button and search for the service in the second tab:
Check that the WSDL file is properly showing:
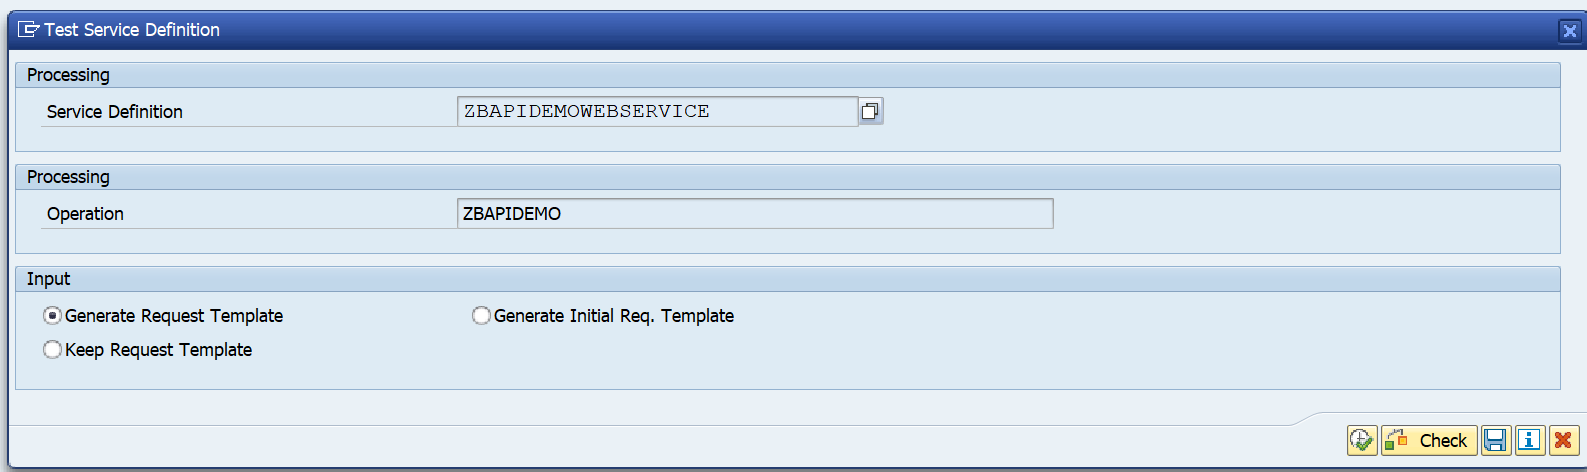
If ok, press the test button (F8) to start the test tool:
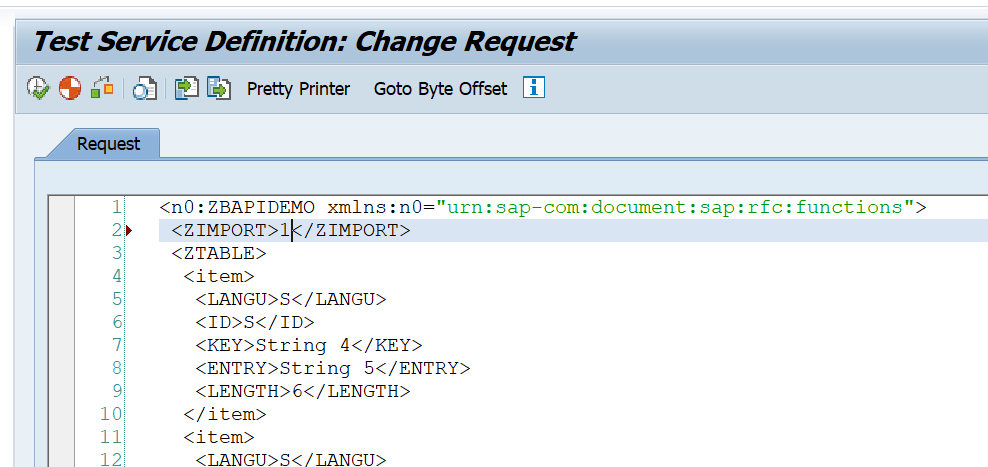
On the next screen first press the XML editor button to allow the content to be changed:
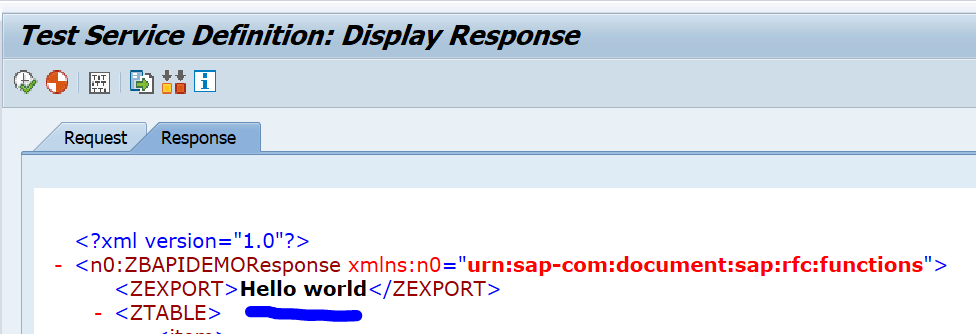
Now press execute to test. The result:
Web service security
The functionality security of the web service is the same as for the generic RFC handling (see blog on this).
The technical security of web services is mainly driven from the security settings in SOAMANAGER. There you can set the transport protocol security and you can indicate if you want simple user ID / password security or work with additional certificates for server to server authentication.
The user calling the SAP web service must have the authorization object S_SERVICE. In S_SERVICE you can define the specific web service it needs to be able to call.
SAP has many different ways to interface. The RFC (Remote Function Call) protocol is one of the most wide used.
This blog will explain best practices around secure and correct setup of custom built ABAP RFC function modules.
Questions that will be answered are:
How to setup RFC enabled function module?
How to setup proper RFC error handling?
How to setup security in RFC enabled function module?
How strict is the S_RFC authorization handling?
Why is SAP_ALL not sufficient for RFC handling?
How can I check RFC logon issues?
Creation of test RFC enabled function module
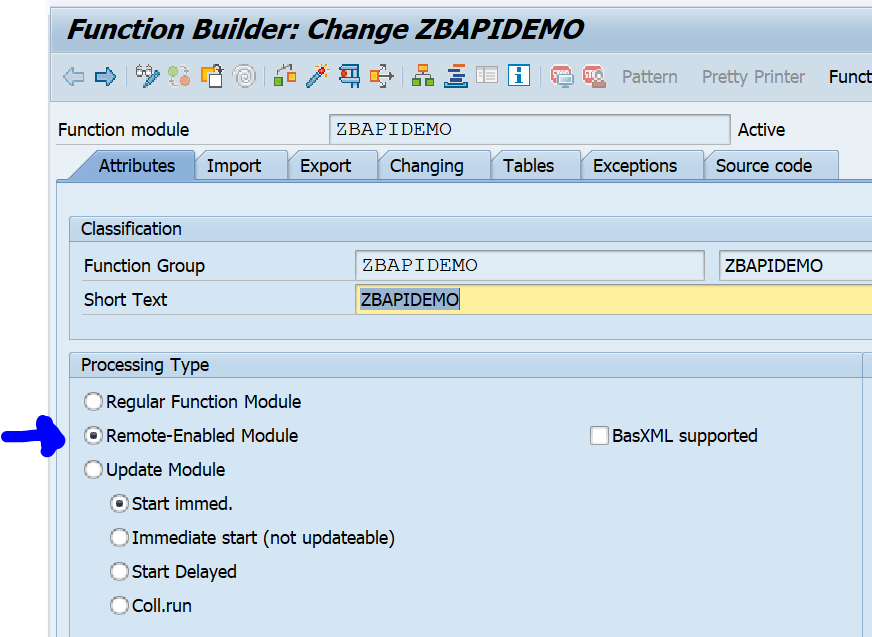
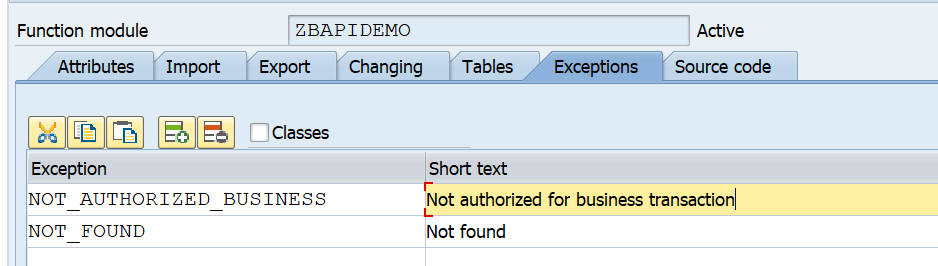
In SE37 you can setup an RFC enabled function module just like a normal function module. First create a function group. Activate that function group in SE80. Now you can create the function module. We will call our test module ZBAPIDEMO:
Important here in the first tab is to set the processing type to Remote-Enabled Module.
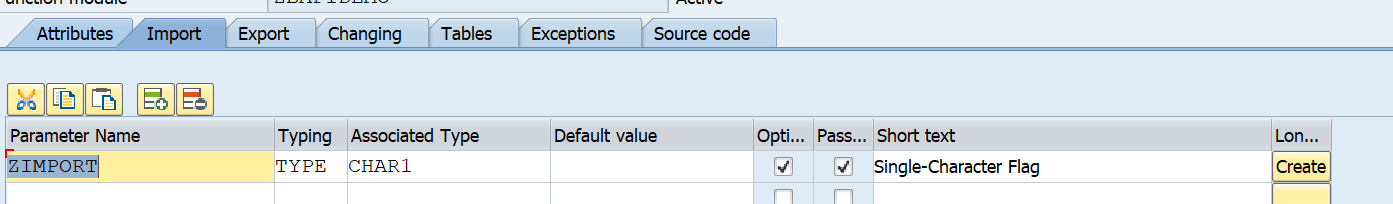
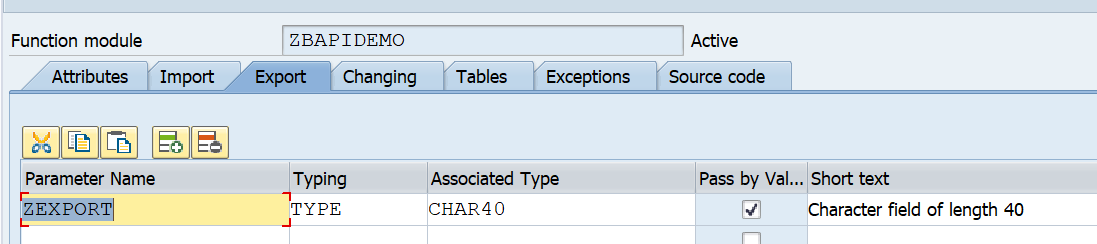
For testing we setup import and export tabs:
Important here with RFC: set the Pass by value tickbox.
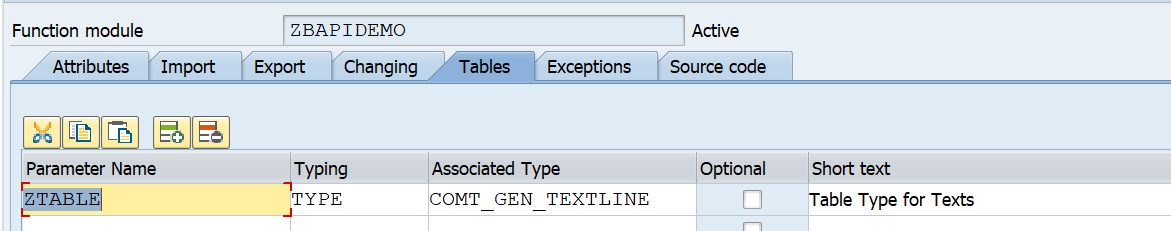
For tables use a suitable table type:
And setup the correct exceptions:
Here you can see 2 very important error messages that should always be implemented:
An extra authorization check
An error message when no data is found
Now we can implement the following simple source code:
   DATA: zls_coms_gen_textline TYPE coms_gen_textline.

   AUTHORITY-CHECK OBJECT 'S_CDMC'
   ID 'CDMC_AREA' FIELD 'A'
   ID 'CDMC_ROLE' FIELD 'U'.
   IF sy-subrc EQ 0.

     CASE zimport.
       WHEN 1.
         zexport = 'Hello world'.
       WHEN 2.
         zls_coms_gen_textline-entry = 'Hello world table 1'.
         APPEND zls_coms_gen_textline TO ztable.
         zls_coms_gen_textline-entry = 'Hello world table 2'.
         APPEND zls_coms_gen_textline TO ztable.
       WHEN OTHERS.
         RAISE not_found.
     ENDCASE.

   ELSE.
     RAISE not_authorized_business.
   ENDIF.
What is important here in this source code:
The authorization check is implemented and raises an error
If no data is found the NOT_FOUND error is raised
With the SE37 test suite you can test diverse scenario’s now.
Calling RFC function module from another ABAP system
If you call this RFC function module form another ABAP sytem you have to make sure you have set and check the following exceptions:
COMMUNICATION_FAILURE: the call to the other system fails. Most likely if you go to SM59 to the RFC destination and perform a connection test you will get a failure.
OTHERS: something else went wrong
The developer should take proper care of these error situations.
Dear ABAP developers: the basis team member are also humans. They will make RFC configuration errors, they rely on the authorization team to assign the correct roles and they rely on infrastructure providers to make sure systems are up and running. Also the basis team will need to perform patching and upgrades to the system, which you as ABAP developer, are calling. So please don't blame the basis team for these exceptions, but please be a good developer and implement proper error handling. If you didn't implement proper error handling, and something went wrong on basis side, that caused your code to go wrong, think twice before putting blame on basis if your code is not handling the situation properly.
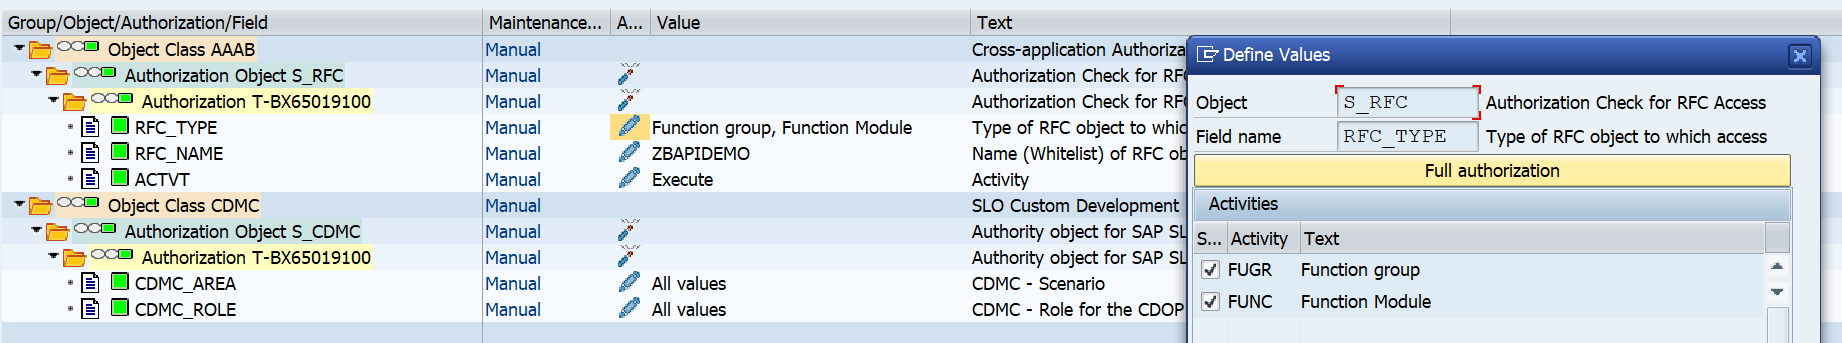
The RFC layer is protected by authorization object S_RFC:
Here you can choose between a function group or even allowing per function module. Personally I would protect by function module. Background: create, change and display BAPI’s will normally be developed inside same function group.
There is a common misunderstanding that if you give SAP_ALL to a (background) user, this would solve the RFC authorization issues. This is not true. SAP_ALL does not contain the S_RFC rights. You have to hand them out separately.
Best practice 1: you might want to start with broad authorizations at the beginning of a development to rule out authorization issues. But you must definitely limit the rights before you make the development go productively live.
Best practice 2: as first statement inside each and every RFC function module, program a relevant business authorization check statement. This is an extra safety measure that is needed to protect important business data from authorization consultants that have handed out * authorizations in object S_RFC (* means all).
Best practice 3: check in transaction SM59 that the RFC callback protection is activated. Read this blog how a hacker can easily misuse if not properly setup.
Best practice 4: be careful on the RFC setup to avoid that hackers misuse the RFC jumping option. Read more in this blog.
More on checking the basis RFC security: read this blog.
Generic S_RFC check handling at basis level
The behavior of the S_RFC check is driven by the settings of RZ11 profile parameter auth/rfc_authorithy_check. Please make sure it has a setting of 6 or higher. Best is 9. A system with 5 or lower can be considered as insecure!
Set up of trusted RFC connections are explained in this blog.
RFC performance
Check if you can use the RFC fast serialization option. This option is available for a lot of modern SAP systems. It is not activated by default. Read more on the fast serialization option in this blog.